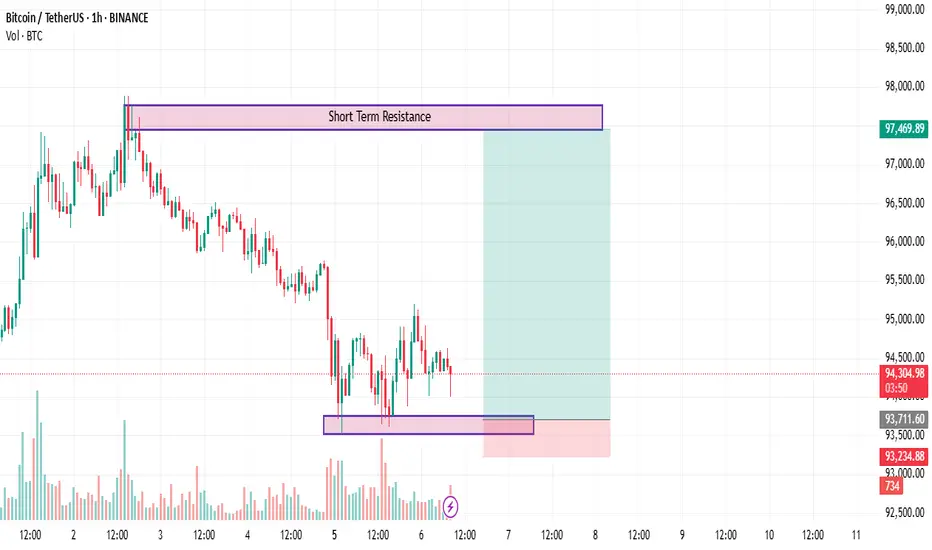
This chart highlights two significant zones for BTC/USDT on the 1-hour timeframe. The lower purple zone represents a demand area where buyers have previously shown interest, indicating potential support. The upper purple zone marks a short-term barrier where previous upward movements have paused, suggesting overhead pressure.
The current price action shows BTC consolidating near the support region. A move upward from this level could lead to a retest of the upper resistance zone, providing a favorable risk-to-reward scenario. Volume levels are also monitored for confirmation of momentum.
The current price action shows BTC consolidating near the support region. A move upward from this level could lead to a retest of the upper resistance zone, providing a favorable risk-to-reward scenario. Volume levels are also monitored for confirmation of momentum.
トレード終了: 利益確定目標に到達
*Status Update: Target Achieved*
The projected target level in the Bitcoin (BTC/USDT) setup has been successfully reached. After consolidating at the support zone, the price surged with strong bullish momentum, breaking through the resistance zone. The upward movement continued, hitting the short-term resistance level as anticipated. This successful move confirms the analysis based on momentum and breakout strategy.
The setup has been executed effectively, with the expected target achieved as planned.
免責事項
これらの情報および投稿は、TradingViewが提供または保証する金融、投資、取引、またはその他の種類のアドバイスや推奨を意図したものではなく、またそのようなものでもありません。詳しくは利用規約をご覧ください。
免責事項
これらの情報および投稿は、TradingViewが提供または保証する金融、投資、取引、またはその他の種類のアドバイスや推奨を意図したものではなく、またそのようなものでもありません。詳しくは利用規約をご覧ください。