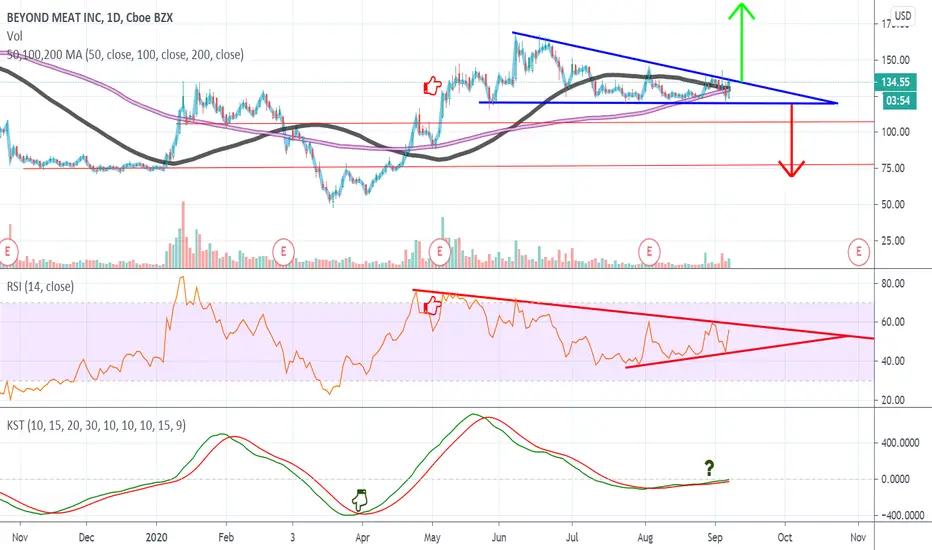
On the RSI there was a noticeable bearish divergence that started in May where I have the red finger pointing sideways, meaning, the price was increasing but the RSI was decreasing, it appears as though the divergence has completed.
On the KST there's potentially a bullish cross happening, I have placed a green finger icon to represent a previous bullish cross, and a question mark to represent where there's one potentially happening now.
On the KST there's potentially a bullish cross happening, I have placed a green finger icon to represent a previous bullish cross, and a question mark to represent where there's one potentially happening now.
免責事項
これらの情報および投稿は、TradingViewが提供または保証する金融、投資、取引、またはその他の種類のアドバイスや推奨を意図したものではなく、またそのようなものでもありません。詳しくは利用規約をご覧ください。
免責事項
これらの情報および投稿は、TradingViewが提供または保証する金融、投資、取引、またはその他の種類のアドバイスや推奨を意図したものではなく、またそのようなものでもありません。詳しくは利用規約をご覧ください。