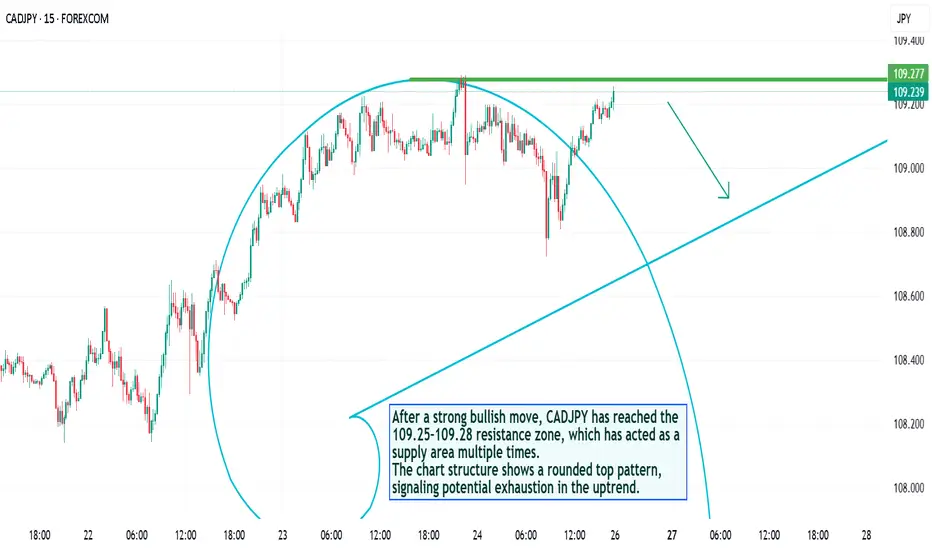
After a strong bullish move, CADJPY has reached the 109.25–109.28 resistance zone, which has acted as a supply area multiple times.
The chart structure shows a rounded top pattern, signaling potential exhaustion in the uptrend.
💡 Technical View:
Price repeatedly rejected from 109.27 zone.
Rounded top indicates weakening buying momentum.
A descending curve formation suggests upcoming bearish correction.
Rising trendline below (around 108.80–108.60) could be the next target zone.
📉 Trade Setup (Signal):
Entry (Sell): below 109.20
Stop Loss: 109.35
Take Profit 1: 108.90
Take Profit 2: 108.60
🧭 Bias: Short-term bearish
💬 Expecting price to turn down after testing resistance. If the pair breaks above 109.35 with volume, bearish view becomes invalid.
免責事項
これらの情報および投稿は、TradingViewが提供または保証する金融、投資、取引、またはその他の種類のアドバイスや推奨を意図したものではなく、またそのようなものでもありません。詳しくは利用規約をご覧ください。
免責事項
これらの情報および投稿は、TradingViewが提供または保証する金融、投資、取引、またはその他の種類のアドバイスや推奨を意図したものではなく、またそのようなものでもありません。詳しくは利用規約をご覧ください。