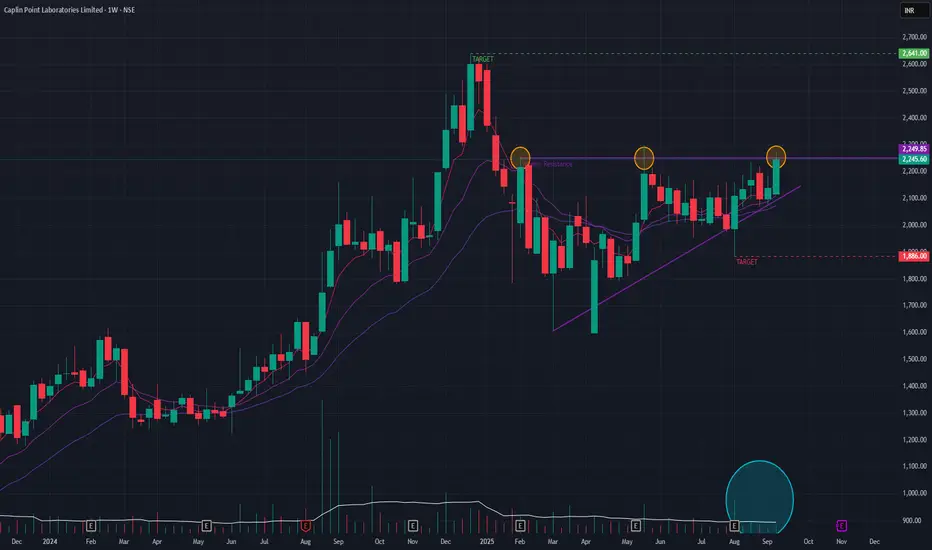
After a brief downtrend, Caplin Point has formed a classic triangle pattern, which often acts as a continuation signal for the preceding long-term uptrend. Technical indicators are favorable, with the short-term EMAs arranged in a bullish formation that signals strong underlying momentum.
The one element of caution is that recent trading volumes have been average. Therefore, a breakout from the triangle must be accompanied by a significant increase in volume to validate buyer conviction. If such a breakout occurs, the next logical objective would be the all-time high, which also serves as a key resistance zone at ₹2640. Conversely, if the pattern fails and momentum wanes, a pullback to the ₹1886 support level is possible.
Watchout for the price-action !!
Disclaimer: This analysis is my personal view & for educational purposes only. They shall not be construed as trade or investment advice. Before making any financial decision, it is imperative that you consult with a qualified financial professional.
免責事項
これらの情報および投稿は、TradingViewが提供または保証する金融、投資、取引、またはその他の種類のアドバイスや推奨を意図したものではなく、またそのようなものでもありません。詳しくは利用規約をご覧ください。