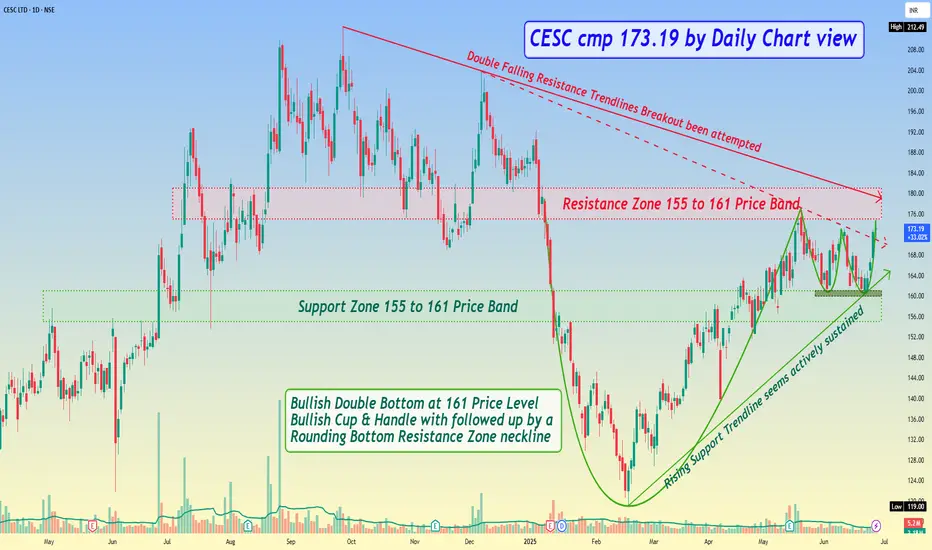
*CESC cmp 173.19 by Daily Chart view*
- Support Zone 155 to 161 Price Band
- Resistance Zone 155 to 161 Price Band
- Bullish Double Bottom at 161 Price Level
- Rising Support Trendline seems actively sustained
- Volumes spiking seen in sync with the avg traded quantity
- Double Falling Resistance Trendlines Breakout been attempted
- Bullish Cup & Handle with followed up by a Rounding Bottom Resistance Zone neckline
関連の投稿
免責事項
この情報および投稿は、TradingViewが提供または推奨する金融、投資、トレード、その他のアドバイスや推奨を意図するものではなく、それらを構成するものでもありません。詳細は利用規約をご覧ください。
免責事項
この情報および投稿は、TradingViewが提供または推奨する金融、投資、トレード、その他のアドバイスや推奨を意図するものではなく、それらを構成するものでもありません。詳細は利用規約をご覧ください。