Price Action:
Price Movement Characteristics:
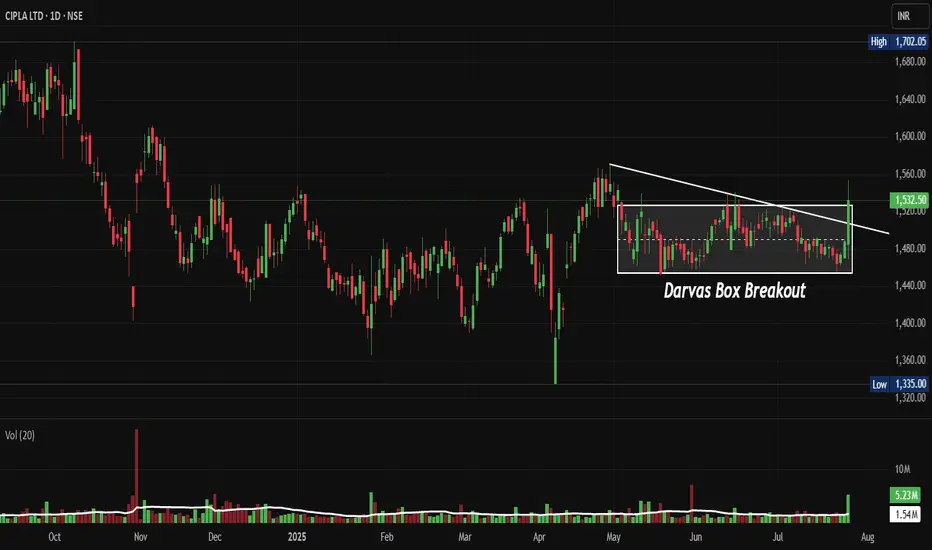
- Volatility: Compressed volatility within the Darvas Box range
- Price Swings: Controlled swings between ₹1,480-1,532.50 boundaries
- Breakout Attempts: Multiple tests of upper resistance without sustained follow-through
- Support Tests: Clean bounces from the lower boundary showing strong institutional support
Volume Spread Analysis
- Current Volume: 5.23M (above 20-day average)
- Volume Pattern: Declining during consolidation (bullish accumulation sign)
- Volume Spike Required: Need 1.5x average volume for breakout confirmation
- Volume Trend: Steady participation without panic selling
Market Structure Analysis:
- Higher Lows Formation: Gradual increase in swing lows within the consolidation
- Lower Highs Compression: Resistance level holding firm, creating compression
- Price Coiling: Decreasing range suggesting energy buildup for directional move
- Time Compression: Extended sideways movement indicating a major move is pending
Chart Pattern Recognition:
- Primary Pattern: Darvas Box Formation (clearly marked on the chart)
- Box Range: ₹1,480 - ₹1,532.50 consolidation zone
- Pattern Duration: Approximately 3-4 months of sideways consolidation
- Volume Context: Declining volume during the consolidation phase, typical of accumulation
Candlestick Pattern Analysis:
- Recent Candles Formation: Doji and small-bodied candles indicating indecision at resistance
- Candle Bodies: Predominantly small bodies suggesting balanced buying/selling pressure
- Wicks Analysis: Upper wicks at resistance showing selling pressure, lower wicks showing support
- Colour Distribution: Mixed red/green candles within the box showing consolidation
Key Support and Resistance Levels:
- Immediate Support: ₹1,480 (Darvas Box lower boundary)
- Strong Support: ₹1,420 (previous swing low)
- Critical Support: ₹1,335 (yearly low)
- Immediate Resistance: ₹1,532.50 (Darvas Box upper boundary)
- Target Resistance: ₹1,600-1,620 (measured move projection)
- Ultimate Target: ₹1,700+ (analyst consensus target)
Base Formation:
- Base Type: Rectangular consolidation/Darvas Box
- Base Duration: 3-4 months (adequate for institutional accumulation)
- Base Tightness: Well-defined boundaries showing controlled supply
- Breakout Confirmation: Price action at upper boundary with volume expansion needed
Trend Analysis:
- Short-term Trend: Sideways consolidation
- Medium-term Trend: Neutral to slightly bullish
- Long-term Trend: Recovery phase from 2024 lows
Momentum Indicators:
- Current Momentum: Building up for potential breakout
- Price Position: Near upper boundary of consolidation range
- Market Structure: Higher lows formation within the box
Trade Setup Strategy:
Entry Strategy:
- Primary Entry: Breakout above ₹1,535 with volume confirmation
- Secondary Entry: Retest of breakout level around ₹1,520-1,525
- Conservative Entry: Support bounce from ₹1,485-1,490
Target Levels:
- Target 1: ₹1,580 (initial resistance)
- Target 2: ₹1,620 (measured move from box height)
- Target 3: ₹1,700 (analyst target consensus)
- Long-term Target: ₹1,800+ (bull case scenario)
Stop-Loss Levels:
- Aggressive: ₹1,470 (below box support)
- Conservative: ₹1,450 (below key support zone)
- Risk Management: ₹1,420 (major support failure)
Position Sizing Guidelines:
- High Conviction: 2-3% of portfolio (on confirmed breakout)
- Medium Conviction: 1-2% of portfolio (on retest entry)
- Conservative: 0.5-1% of portfolio (support bounce play)
- Maximum Risk per Trade: Not more than 1% of total capital
Risk Management Framework:
- Risk-Reward Ratio: Minimum 1:2 for all entries
- Position Scaling: Add on strength after initial 5% move
- Profit Booking: Book 30% at Target 1, 40% at Target 2, trail rest
- Stop-Loss Management: Trail stop to breakeven after 7-8% profit
Sectoral and Fundamental Backdrop:
Pharmaceutical Sector Outlook:
- Market Size: The Indian pharma market is expected to reach US$18.8 billion by 2028 at an 8% CAGR
- Global Position: 500 facilities approved by the US FDA, the highest number outside the US
- Growth Drivers: Speedy introduction of generic drugs and focus on rural health programmes
CIPLA Fundamental Strengths:
- Market Capitalization: ₹1,23,842 Crore
- Performance: ₹27,548 Cr revenue with ₹5,269 Cr profit
Key Fundamental Concerns:
- Growth Rate: Poor sales growth of 10% over the past five years
- Promoter Holding: Decreased by 4.42% over the last 3 years, currently at 29.19%
Industry Catalysts:
- FDA Approvals: India has received 6,316 USFDA approvals for formulation plants
- Global Market Share: India supplies 40 per cent of generic drugs globally
- Export Potential: Strong positioning as a global generic supplier
Risk Assessment:
Technical Risks:
- Pattern Failure: Box breakdown below ₹1,470 would negate the bullish thesis
- Volume Concerns: Breakout without volume confirmation could lead to a false move
- Market Sentiment: Broader market correction could impact individual stock performance
Fundamental Risks:
- Regulatory Changes: FDA compliance issues or policy changes
- Competition: Intense pricing pressure in the generic segment
- Currency Risk: Rupee fluctuation impact on export revenues
Market Risks:
- Sector Rotation: Money flow away from the pharma sector
- Global Slowdown: Impact on export-dependent business model
- Geopolitical Factors: Trade tensions affecting pharmaceutical exports
My Take:
Trading/Investment Thesis:
The Darvas Box pattern on
My Action Plan:
- Watch for breakout above ₹1,535 with 1.5x volume
- Enter in phases rather than a lump-sum investment
- Maintain strict stop-loss discipline
- Book profits in tranches as targets are achieved
Keep in the Watchlist and DOYR.
NO RECO. For Buy/Sell.
📌Thank you for exploring my idea! I hope you found it valuable.
🙏FOLLOW for more
👍BOOST if you found it useful.
✍️COMMENT below with your views.
Meanwhile, check out my other stock ideas on the right side until this trade is activated. I would love your feedback.
Disclaimer: "I am not a SEBI REGISTERED RESEARCH ANALYST AND INVESTMENT ADVISER."
This analysis is intended solely for informational and educational purposes and should not be interpreted as financial advice. It is advisable to consult a qualified financial advisor or conduct thorough research before making investment decisions.
関連の投稿
免責事項
この情報および投稿は、TradingViewが提供または推奨する金融、投資、トレード、その他のアドバイスや推奨を意図するものではなく、それらを構成するものでもありません。詳細は利用規約をご覧ください。
関連の投稿
免責事項
この情報および投稿は、TradingViewが提供または推奨する金融、投資、トレード、その他のアドバイスや推奨を意図するものではなく、それらを構成するものでもありません。詳細は利用規約をご覧ください。