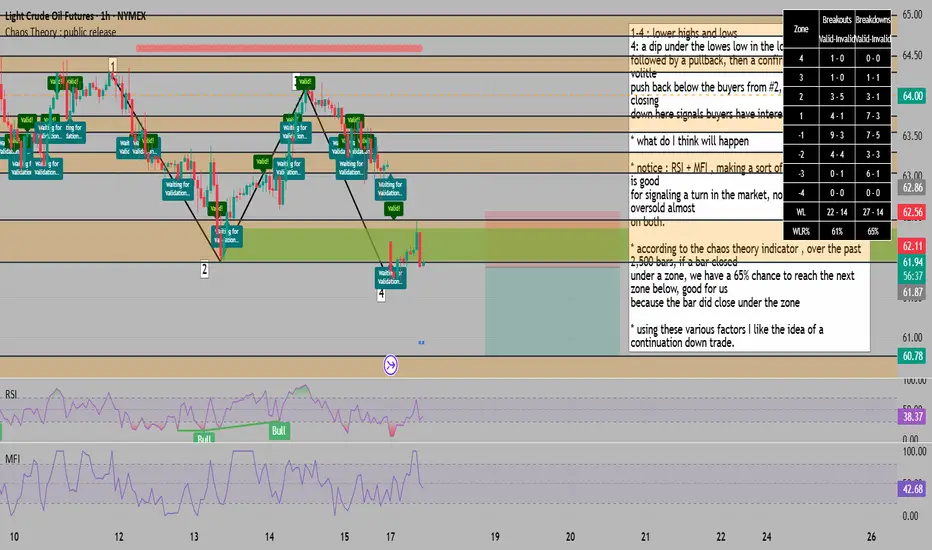
1-4 : lower highs and lows
4: a dip under the lowes low in the local structure ,
followed by a pullback, then a confirmation STRONG volitle
push back below the buyers from #2, for me the candle closing
down here signals buyers have interest
* what do I think will happen
* notice : RSI + MFI , making a sort of triangle shape, this is good
for signaling a turn in the market, not to mention oversold almost
on both.
* according to the chaos theory indicator , over the past 2,500 bars, if a bar closed
under a zone, we have a 65% chance to reach the next zone below, good for us
because the bar did close under the zone
* using these various factors I like the idea of a continuation down trade.
for trading mentorship and community, message me on telegram : jacesabr_real
免責事項
これらの情報および投稿は、TradingViewが提供または保証する金融、投資、取引、またはその他の種類のアドバイスや推奨を意図したものではなく、またそのようなものでもありません。詳しくは利用規約をご覧ください。
for trading mentorship and community, message me on telegram : jacesabr_real
免責事項
これらの情報および投稿は、TradingViewが提供または保証する金融、投資、取引、またはその他の種類のアドバイスや推奨を意図したものではなく、またそのようなものでもありません。詳しくは利用規約をご覧ください。