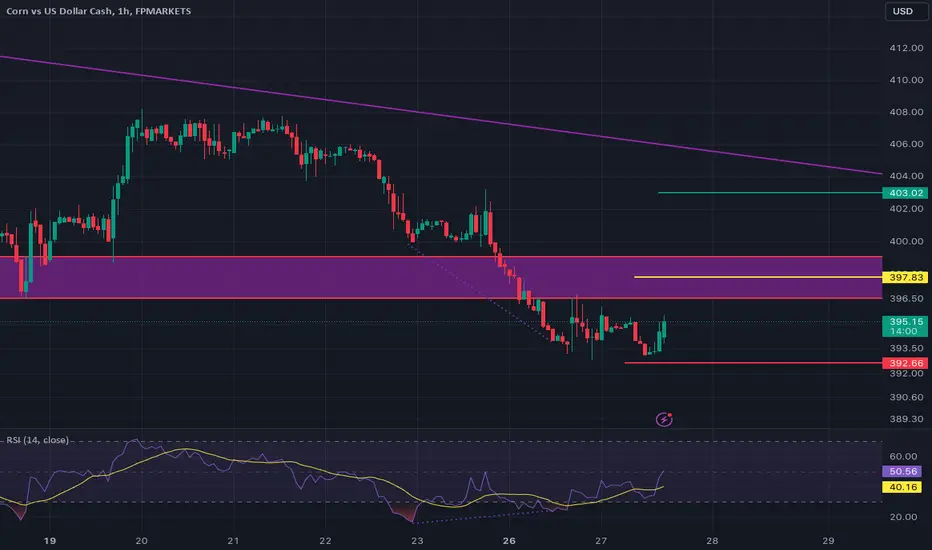
Corn analysis is done on an hourly chart. There is a bullish divergence on an hourly chart with a formation of double bottom reversal pattern. Placed an entry on the previous LH with SL placed just below the double bottom.
The Signal is:
EP: 397.83
SL: 392.66
TP: 403.00
The Signal is:
EP: 397.83
SL: 392.66
TP: 403.00
免責事項
これらの情報および投稿は、TradingViewが提供または保証する金融、投資、取引、またはその他の種類のアドバイスや推奨を意図したものではなく、またそのようなものでもありません。詳しくは利用規約をご覧ください。
免責事項
これらの情報および投稿は、TradingViewが提供または保証する金融、投資、取引、またはその他の種類のアドバイスや推奨を意図したものではなく、またそのようなものでもありません。詳しくは利用規約をご覧ください。