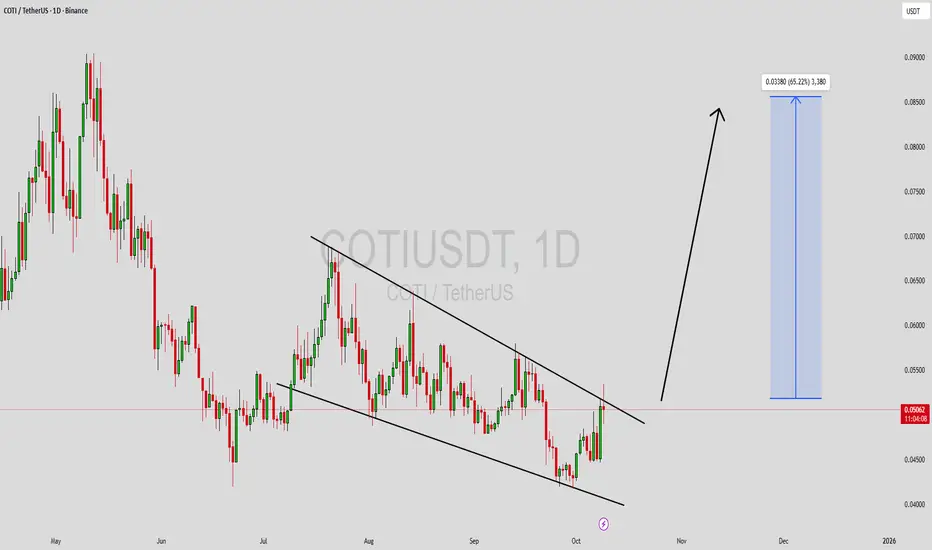
COTIUSDT is showing a Falling Wedge Pattern, one of the most powerful bullish reversal setups in technical analysis. This formation suggests that the ongoing downtrend may be losing momentum, and a strong bullish breakout could be approaching soon. The narrowing structure of the wedge indicates reduced selling pressure and growing demand as buyers gradually step in. COTI has been consolidating for some time, and this compression phase could soon translate into a sharp upward movement.
The volume remains strong, confirming that accumulation is taking place beneath the surface. Once the price breaks out from the upper resistance of the wedge, traders may witness an explosive rally, potentially delivering gains of 50% to 650%+ in the medium term. This kind of setup often attracts both short-term traders and long-term investors looking to capitalize on a high-risk, high-reward opportunity.
Investor sentiment around COTI is improving as the broader market shows signs of strength. The combination of bullish technicals, solid trading activity, and renewed interest makes COTIUSDT a promising candidate for a major price breakout. Keep a close watch on the breakout zone, as momentum could accelerate quickly once confirmation arrives.
✅ Show your support by hitting the like button and
✅ Leaving a comment below! (What is You opinion about this Coin)
Your feedback and engagement keep me inspired to share more insightful market analysis with you!
🟢🟢🟢Join Our Telegram Here to Get Trades With Entry And Exit 🟢🟢🟢
cryptotelegram.bio.link/
🟢🟢🟢
cryptotelegram.bio.link/
🟢🟢🟢
免責事項
これらの情報および投稿は、TradingViewが提供または保証する金融、投資、取引、またはその他の種類のアドバイスや推奨を意図したものではなく、またそのようなものでもありません。詳しくは利用規約をご覧ください。
🟢🟢🟢Join Our Telegram Here to Get Trades With Entry And Exit 🟢🟢🟢
cryptotelegram.bio.link/
🟢🟢🟢
cryptotelegram.bio.link/
🟢🟢🟢
免責事項
これらの情報および投稿は、TradingViewが提供または保証する金融、投資、取引、またはその他の種類のアドバイスや推奨を意図したものではなく、またそのようなものでもありません。詳しくは利用規約をご覧ください。