Bullish Strategy on Salesforce (CRM)
Looking at the daily chart of CRM, several technical signals support a medium-term bullish outlook:
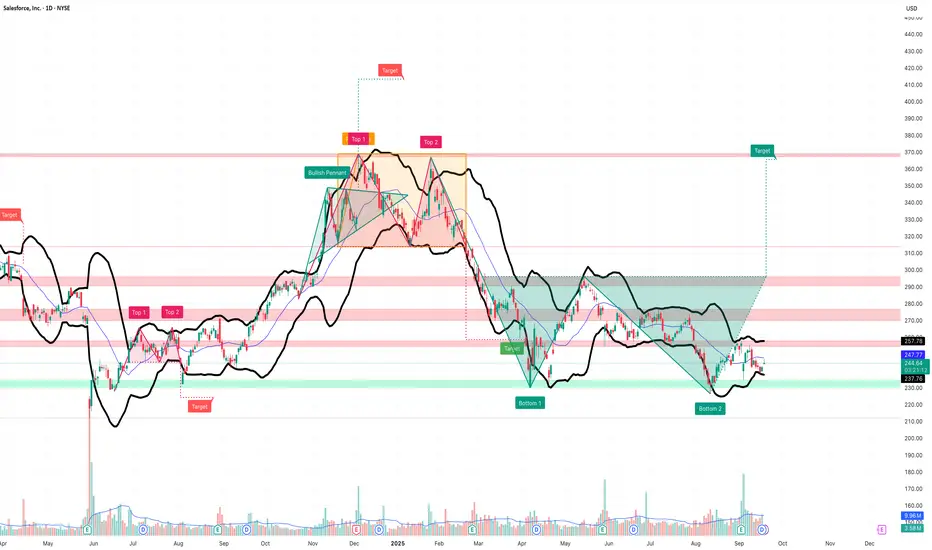
Double Bottom Pattern
A clear double bottom (Bottom 1 and Bottom 2) has formed between April and September.
This classic reversal pattern often signals the end of a downtrend and the start of a new bullish phase.
Falling Channel Breakout
After months of correction, price broke out of the descending channel, showing technical strength.
Projected Target
The double bottom projection suggests a potential upside toward 370 USD.
First key resistance lies at the 265–270 USD area, also aligned with a strong volume zone.
Supporting Indicators
Bollinger Bands: price is moving near the lower band, often a sign of a possible rebound.
Volumes: spikes observed around the bottoms, typical of accumulation phases.
🎯 Trading Plan
Entry zone: 240–247 USD (current consolidation).
First target: 270 USD.
Second target: 370 USD (pattern projection).
Stop-loss: below 227–230 USD (a breakdown would invalidate the setup).
👉 In summary: the technical setup shows accumulation signals and a potential reversal, offering a favorable risk/reward ratio for a bullish strategy.
免責事項
これらの情報および投稿は、TradingViewが提供または保証する金融、投資、取引、またはその他の種類のアドバイスや推奨を意図したものではなく、またそのようなものでもありません。詳しくは利用規約をご覧ください。
免責事項
これらの情報および投稿は、TradingViewが提供または保証する金融、投資、取引、またはその他の種類のアドバイスや推奨を意図したものではなく、またそのようなものでもありません。詳しくは利用規約をご覧ください。