Even though the rate of DASH has increased by 0.5% over the day, the general picture remains bearish.
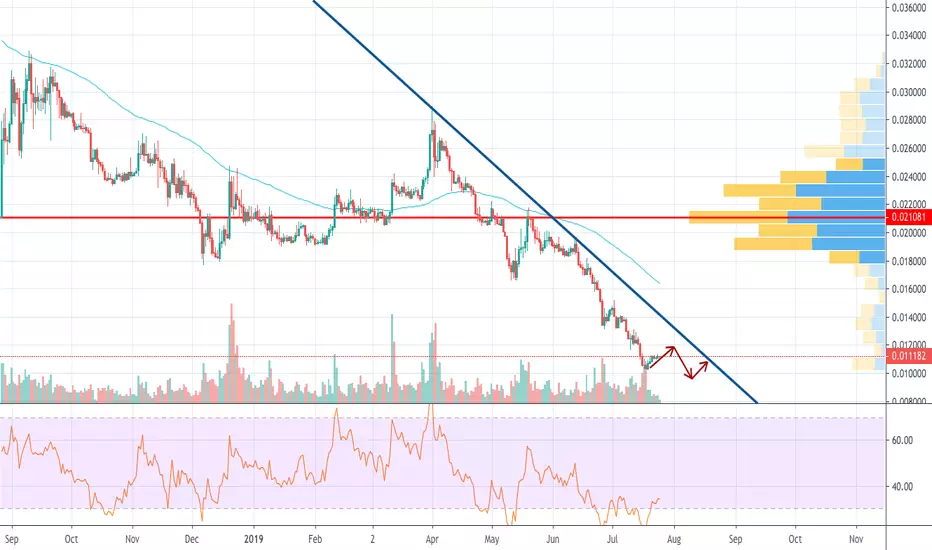
According to the chart, DASH has been declining since April 1, and there are no signals of a possible reversal. The RSI indicator is located near the oversold area, however, DASH is going to strike neither in the short no in the long-term scenario. Overall, the price is likely to fluctuate with a further drop to the area of 0.01 BTC.
According to the chart, DASH has been declining since April 1, and there are no signals of a possible reversal. The RSI indicator is located near the oversold area, however, DASH is going to strike neither in the short no in the long-term scenario. Overall, the price is likely to fluctuate with a further drop to the area of 0.01 BTC.
免責事項
これらの情報および投稿は、TradingViewが提供または保証する金融、投資、取引、またはその他の種類のアドバイスや推奨を意図したものではなく、またそのようなものでもありません。詳しくは利用規約をご覧ください。
免責事項
これらの情報および投稿は、TradingViewが提供または保証する金融、投資、取引、またはその他の種類のアドバイスや推奨を意図したものではなく、またそのようなものでもありません。詳しくは利用規約をご覧ください。