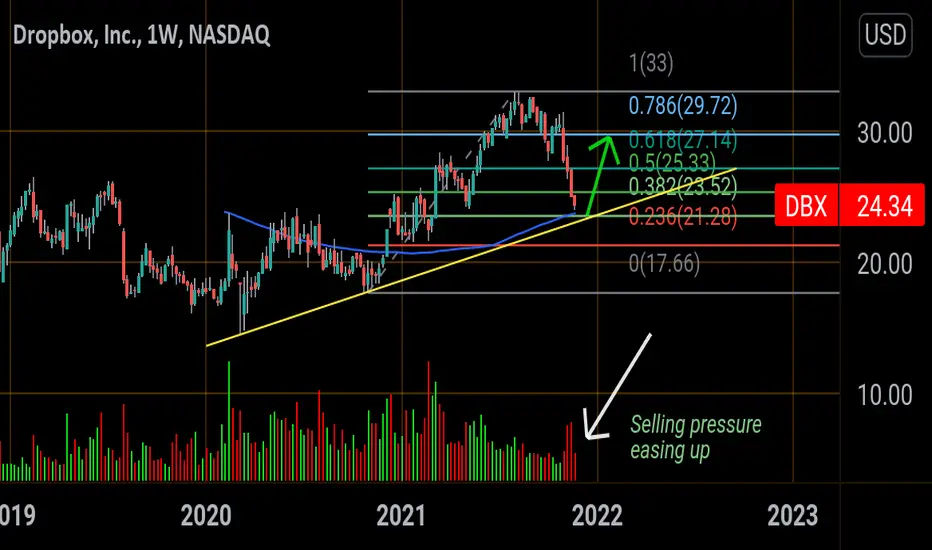
Fibonacci support level - 23.52
Weekly 100sma (Blue line )-23.70
Primary Trendline (Yellow line) - 23.20
Down more than 25% since its 52week high made back in August, A considerable correction here. Look for a bounce in the 23.50 area here with a bullish candle close. If support holds we should be headed back to new 52week high's.
If it closes below 22$ then we must likely will be heading back to 17$ which would represent a 50% drop in this stock from August highs (Crash).
関連の投稿
免責事項
この情報および投稿は、TradingViewが提供または推奨する金融、投資、トレード、その他のアドバイスや推奨を意図するものではなく、それらを構成するものでもありません。詳細は利用規約をご覧ください。
免責事項
この情報および投稿は、TradingViewが提供または推奨する金融、投資、トレード、その他のアドバイスや推奨を意図するものではなく、それらを構成するものでもありません。詳細は利用規約をご覧ください。