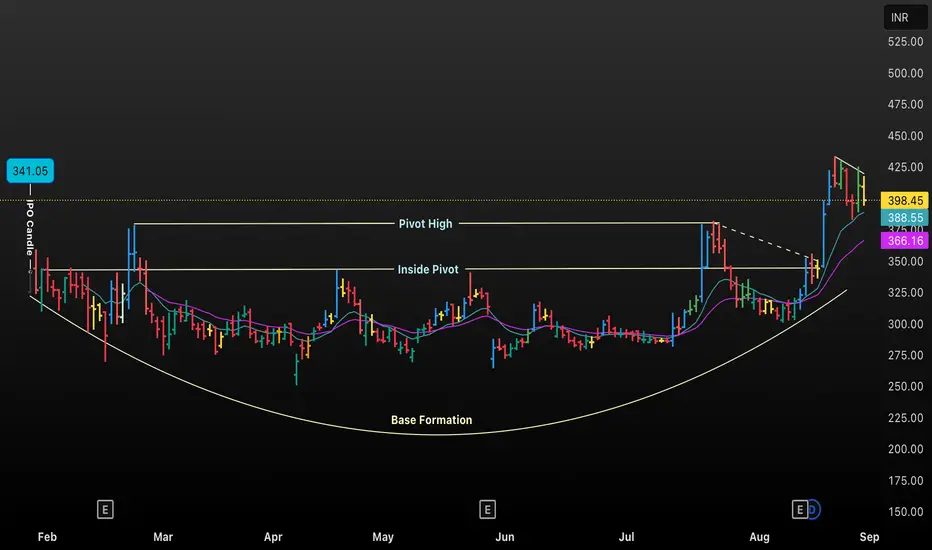
The chart displays the daily price candles for DENTA, highlighting key technical levels: the Pivot High, Inside Pivot, and the rounded Base Formation that characterizes a classic Cup and Handle chart pattern. The IPO Candle signifies the initial price action post-listing. As prices gradually form a rounded bottom, accumulation occurs, followed by an upward breakout above the resistance (Pivot High), indicating bullish momentum. The colored moving averages provide additional context for trend strength and potential support levels.
免責事項
この情報および投稿は、TradingViewが提供または推奨する金融、投資、トレード、その他のアドバイスや推奨を意図するものではなく、それらを構成するものでもありません。詳細は利用規約をご覧ください。
免責事項
この情報および投稿は、TradingViewが提供または推奨する金融、投資、トレード、その他のアドバイスや推奨を意図するものではなく、それらを構成するものでもありません。詳細は利用規約をご覧ください。