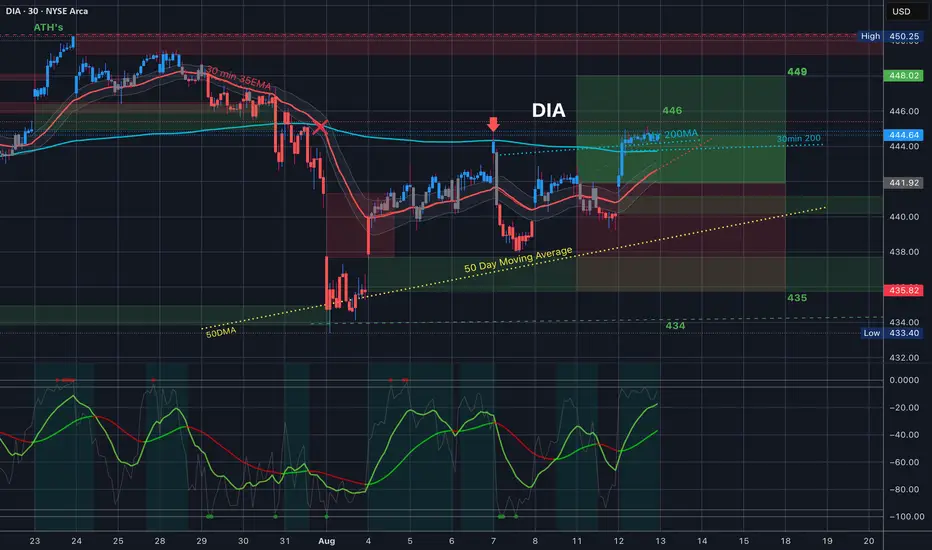
Alright, what a day. DIA, after a down day to start the week, gapped up above the 35EMA and then pushed above the 30min & 1hr 200MA’s which you can see were trading together and traded sideways from there near previous resistance. Still well within the trading range for the week.
(HIT GRAB THIS CHART - UNDER THE CHART NEXT TO THE 🚀)
免責事項
この情報および投稿は、TradingViewが提供または推奨する金融、投資、トレード、その他のアドバイスや推奨を意図するものではなく、それらを構成するものでもありません。詳細は利用規約をご覧ください。
免責事項
この情報および投稿は、TradingViewが提供または推奨する金融、投資、トレード、その他のアドバイスや推奨を意図するものではなく、それらを構成するものでもありません。詳細は利用規約をご覧ください。