📌 Recent Price & Context
Last price around ₹ 14,554–₹ 14,570.
52‑week range: low ~ ₹12,202 and high ~ ₹19,149.
Recent technicals (RSI, MACD, etc.) suggest weak momentum / a “sell” bias on daily chart.
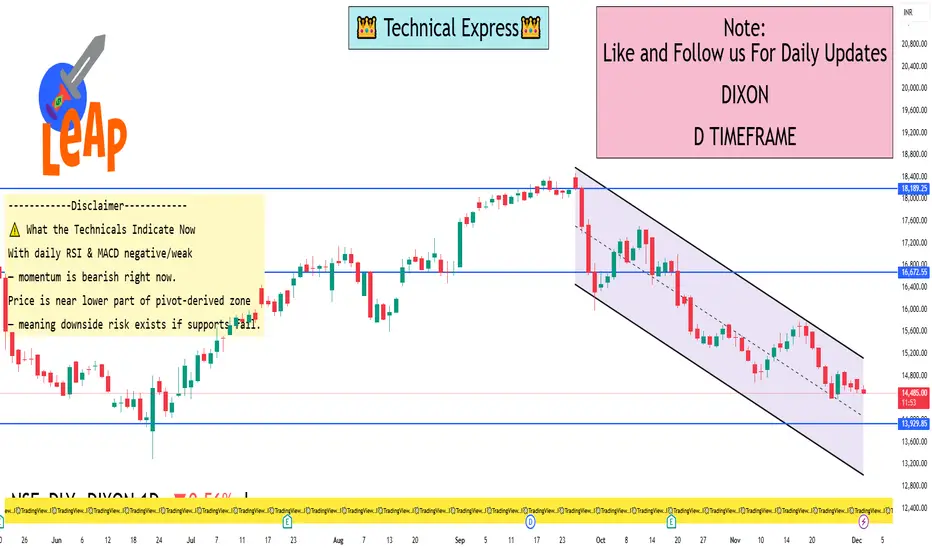
⚠️ What the Technicals Indicate Now
With daily RSI & MACD negative/weak — momentum is bearish right now.
Price is near lower part of pivot‑derived zone — meaning downside risk exists if supports fail.
For bulls to regain control, breaking above ~ ₹14,400–14,500 (R1–R2) would be an encouraging sign — could pave way to medium‑term levels.
If support at ~ ₹14,115–14,020 breaks, the next major support would be around the lower zone / 52‑week low vicinity (but that’s a bigger move).
Last price around ₹ 14,554–₹ 14,570.
52‑week range: low ~ ₹12,202 and high ~ ₹19,149.
Recent technicals (RSI, MACD, etc.) suggest weak momentum / a “sell” bias on daily chart.
⚠️ What the Technicals Indicate Now
With daily RSI & MACD negative/weak — momentum is bearish right now.
Price is near lower part of pivot‑derived zone — meaning downside risk exists if supports fail.
For bulls to regain control, breaking above ~ ₹14,400–14,500 (R1–R2) would be an encouraging sign — could pave way to medium‑term levels.
If support at ~ ₹14,115–14,020 breaks, the next major support would be around the lower zone / 52‑week low vicinity (but that’s a bigger move).
I built a Buy & Sell Signal Indicator with 85% accuracy.
📈 Get access via DM or
WhatsApp: wa.link/d997q0
Contact - +91 76782 40962
| Email: techncialexpress@gmail.com
| Script Coder | Trader | Investor | From India
📈 Get access via DM or
WhatsApp: wa.link/d997q0
Contact - +91 76782 40962
| Email: techncialexpress@gmail.com
| Script Coder | Trader | Investor | From India
関連の投稿
免責事項
この情報および投稿は、TradingViewが提供または推奨する金融、投資、トレード、その他のアドバイスや推奨を意図するものではなく、それらを構成するものでもありません。詳細は利用規約をご覧ください。