Dow Jones Industrial Average (DJI) on the 1-hour timeframe.
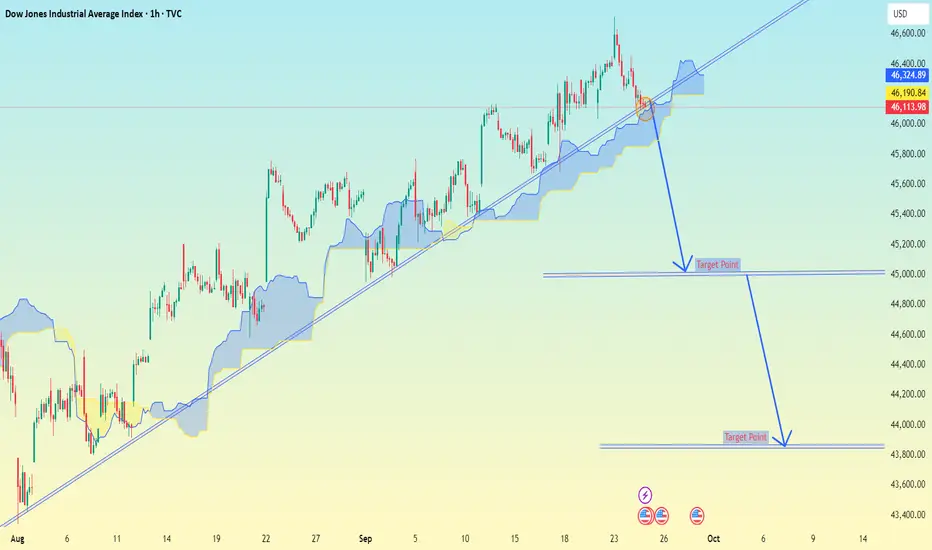
From the chart:
The uptrend line is being tested.
There are two downside target points marked if the trendline breaks.
📉 Target levels shown on the chart:
1. First target zone: around 45,000 – 45,100
2. Second target zone: around 43,800 – 44,000
So if the price breaks the ascending trendline and confirms below it, the next expected supports are roughly:
45,000 area (first support/target)
43,800 area (second support/target)
トレード稼働中
trade active 📲 Join telegram channel free .
t.me/addlist/dg3uSwzkMSplNjFk
Forex, Gold & Crypto Signals with detailed analysis & get consistent results.
t.me/addlist/dg3uSwzkMSplNjFk
Gold Signal's with proper TP & SL for high profit opportunities.
t.me/addlist/dg3uSwzkMSplNjFk
Forex, Gold & Crypto Signals with detailed analysis & get consistent results.
t.me/addlist/dg3uSwzkMSplNjFk
Gold Signal's with proper TP & SL for high profit opportunities.
関連の投稿
免責事項
これらの情報および投稿は、TradingViewが提供または保証する金融、投資、取引、またはその他の種類のアドバイスや推奨を意図したものではなく、またそのようなものでもありません。詳しくは利用規約をご覧ください。
📲 Join telegram channel free .
t.me/addlist/dg3uSwzkMSplNjFk
Forex, Gold & Crypto Signals with detailed analysis & get consistent results.
t.me/addlist/dg3uSwzkMSplNjFk
Gold Signal's with proper TP & SL for high profit opportunities.
t.me/addlist/dg3uSwzkMSplNjFk
Forex, Gold & Crypto Signals with detailed analysis & get consistent results.
t.me/addlist/dg3uSwzkMSplNjFk
Gold Signal's with proper TP & SL for high profit opportunities.
関連の投稿
免責事項
これらの情報および投稿は、TradingViewが提供または保証する金融、投資、取引、またはその他の種類のアドバイスや推奨を意図したものではなく、またそのようなものでもありません。詳しくは利用規約をご覧ください。