We will soon get an excellent buying opportunity in DLF.
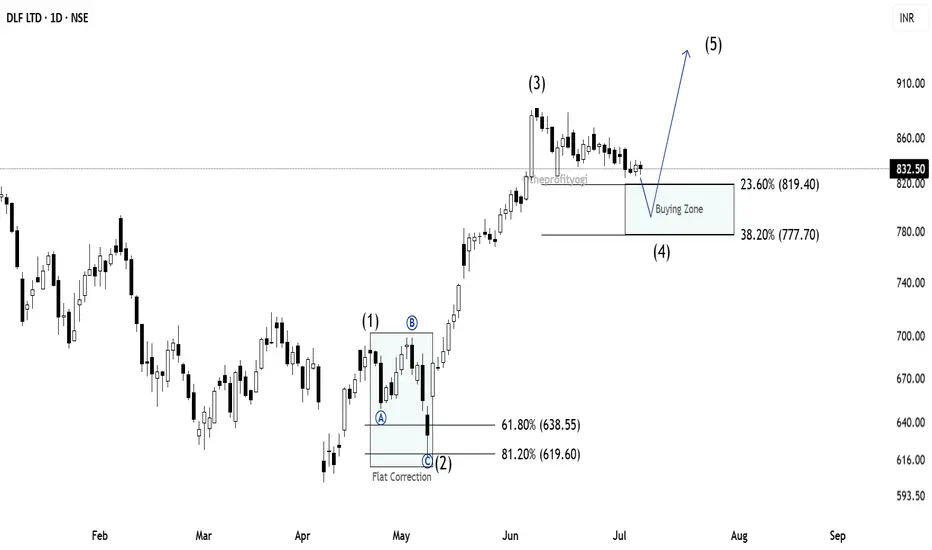
As we can see, I have marked DLF using Elliott Wave theory and Fibonacci.
You can see that, after forming wave (1), the market falls to form wave (2). In wave (2), we can see Flat Correction marked with ABC counting.
Price then moved fast, indicating a clear impulse to form wave (3).
Currently, we are in wave (4) in DLF.
As per the rule, we can expect wave (4) to terminate between 23.6% and 38.2%
This is the most probable zone where we can expect a new impulse, i.e., wave (5), to start.
One has to wait for the market to fall in this Buying zone to get a good buying opportunity.
This analysis is based on Elliott Wave theory and Fibonacci.
This analysis is for educational purposes only.
This is not a buying recommendation.
免責事項
これらの情報および投稿は、TradingViewが提供または保証する金融、投資、取引、またはその他の種類のアドバイスや推奨を意図したものではなく、またそのようなものでもありません。詳しくは利用規約をご覧ください。
免責事項
これらの情報および投稿は、TradingViewが提供または保証する金融、投資、取引、またはその他の種類のアドバイスや推奨を意図したものではなく、またそのようなものでもありません。詳しくは利用規約をご覧ください。