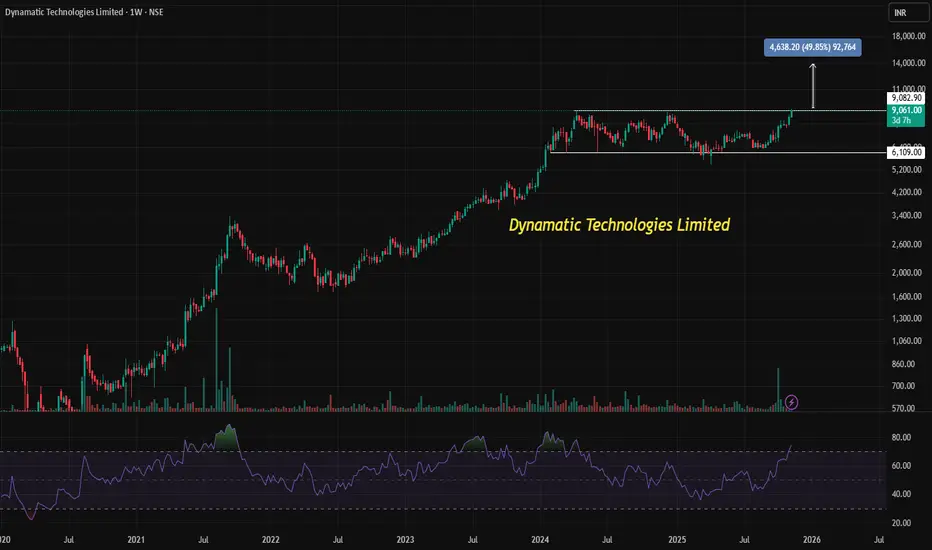
Dynamatic Technologies is showing signs of a bullish breakout from a long consolidation phase, with a potential upside target of ₹13,900–₹14,000 based on the rectangle chart pattern.
📈 Understanding the Rectangle Breakout in Simple Terms
In the world of stock charts, a rectangle pattern is like a pause in a conversation. The price moves sideways within a defined range — bouncing between a top (resistance) and bottom (support) — without making any big moves up or down. This phase is called consolidation, and it often reflects indecision among buyers and sellers.
Rectangle pattern forms when a stock trades between two horizontal lines for a period of time.
Breakout happens when the price finally moves above the resistance line, signaling renewed buying interest.
Breakdown is the opposite — when price falls below support, indicating selling pressure.
This pattern is useful because it helps traders spot potential turning points. Once the breakout occurs, it often leads to a strong price move in the direction of the breakout.
🔍 Dynamatic Technologies: What’s Happening Now?
Dynamatic Technologies Ltd. has been trading in a tight range since April 2024, forming a textbook rectangle pattern on its weekly chart. As of early November 2025, the stock is attempting a positive breakout, currently trading around ₹9,060.
Here’s what makes this breakout noteworthy:
Long consolidation: The stock has been range-bound for over 1.6 years, which builds up potential energy for a strong move.
RSI strength: The Relative Strength Index (RSI), a momentum indicator, has climbed above 70 — a sign that buying momentum is picking up.
Volume and price action: A breakout accompanied by rising volume and strong price movement often confirms the trend.
🎯 How Is the Target Calculated?
The beauty of the rectangle pattern is its simplicity in estimating price targets. The expected move after a breakout is often equal to the height of the rectangle — the distance between the support and resistance levels.
Suppose the rectangle ranged between ₹6,000 and ₹9,000.
The height is ₹3,000,
Add this to the breakout level (₹9,000), and you get a target of ₹12,000.
In Dynamatic’s case, the projected move is even more ambitious — aiming for ₹13,900 to ₹14,000, which suggests a larger rectangle height or a more aggressive breakout.
🧠 Why It Matters for Investors
Rectangle breakouts are popular among traders because they offer:
Clear entry and exit points: Buy on breakout, set stop-loss below support.
Defined risk-reward: The height of the rectangle helps estimate potential gains.
Momentum confirmation: Indicators like RSI help validate the breakout strength.
For long-term investors, such patterns can signal a shift in trend — from sideways to upward — especially when backed by strong fundamentals or news, like Dynamatic’s recent aerospace partnership
✅ Final Thoughts
Dynamatic Technologies is showing technical strength with a rectangle breakout, supported by rising RSI and bullish price action. If the breakout sustains, the stock could potentially reach ₹13,900–₹14,000, offering a compelling opportunity for momentum-driven investors.
免責事項
この情報および投稿は、TradingViewが提供または推奨する金融、投資、トレード、その他のアドバイスや推奨を意図するものではなく、それらを構成するものでもありません。詳細は利用規約をご覧ください。
免責事項
この情報および投稿は、TradingViewが提供または推奨する金融、投資、トレード、その他のアドバイスや推奨を意図するものではなく、それらを構成するものでもありません。詳細は利用規約をご覧ください。