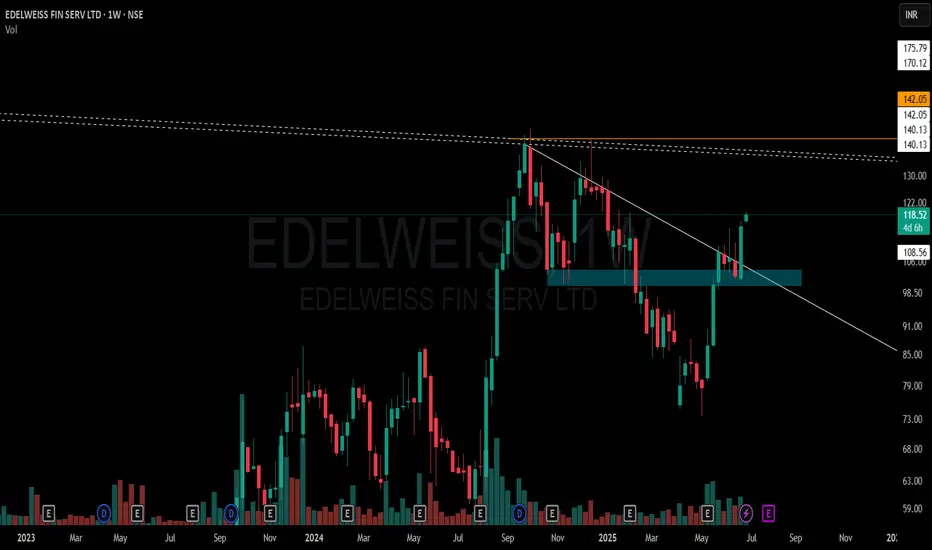
A few key observations on this weekly chart without any forecast bias:
🔹 White Solid Trendline – Marks the active CT (counter-trend) level which has now been decisively taken out.
🔹 Blue Zone – A previously tested supply and demand area has been regained and price is now sustaining above it.
🔹 White Dotted Lines – Multiple short-term weekly hindrances lie just above, acting as micro-resistances.
🔹 Orange Line – Reflects multi-timeframe level confluence and a known volume cluster region to watch ahead.
🔹 Volume has seen a healthy pickup during this breakout, suggesting participation.
📌 Not a recommendation. Just sharing chart structure and price behavior.
🎯 Master My Self-Made Trading Strategy
📈 Telegram (Learn Today): t.me/hashtaghammer
✅ WhatsApp (Learn Today): wa.me/919455664601
📈 Telegram (Learn Today): t.me/hashtaghammer
✅ WhatsApp (Learn Today): wa.me/919455664601
関連の投稿
免責事項
この情報および投稿は、TradingViewが提供または推奨する金融、投資、トレード、その他のアドバイスや推奨を意図するものではなく、それらを構成するものでもありません。詳細は利用規約をご覧ください。