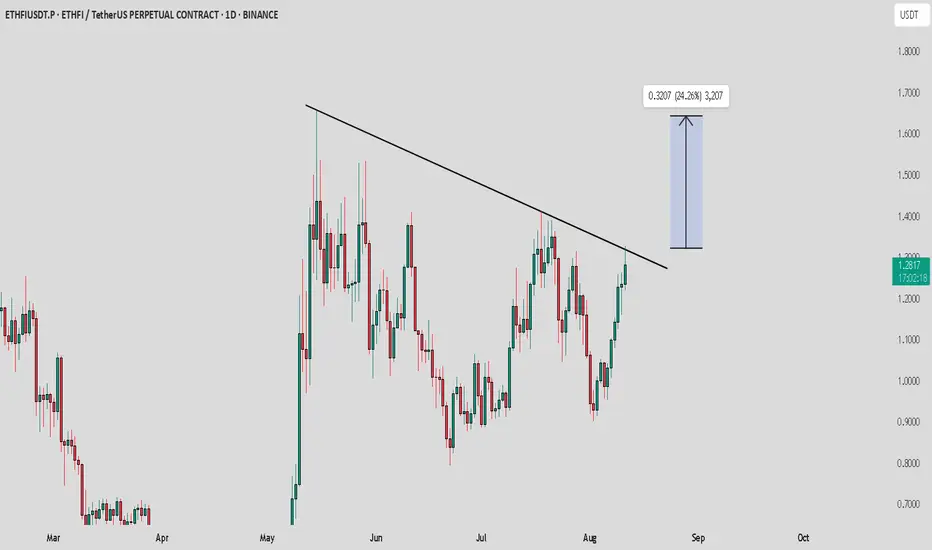
Looking at the ETHFI /USDT chart, we’re seeing a potential bullish breakout forming. After a strong downtrend, price has recently broken the resistance trendline, indicating a possible upward movement. A target of $1.60 (approx. 24% upside) is in sight if the price holds above the trendline.
Key Points:
Breakout above resistance: A strong push above the trendline could signal further upside.
Target Level: $1.60 (24.26% increase).
Momentum: ETH has been showing strength, so keep an eye on confirmation for entry points.
As always, manage your risk and consider the broader market conditions before entering.
🚀 Join my Telegram community for free crypto signals, entry/exit points, and real-time market updates!
👉 t.me/CryptoPrime18
👉 t.me/CryptoPrime18
免責事項
これらの情報および投稿は、TradingViewが提供または保証する金融、投資、取引、またはその他の種類のアドバイスや推奨を意図したものではなく、またそのようなものでもありません。詳しくは利用規約をご覧ください。
🚀 Join my Telegram community for free crypto signals, entry/exit points, and real-time market updates!
👉 t.me/CryptoPrime18
👉 t.me/CryptoPrime18
免責事項
これらの情報および投稿は、TradingViewが提供または保証する金融、投資、取引、またはその他の種類のアドバイスや推奨を意図したものではなく、またそのようなものでもありません。詳しくは利用規約をご覧ください。