ETH/USD 30Min Chart Analysis 🧠📊
🔹 Pattern: Descending wedge – a bullish reversal pattern.
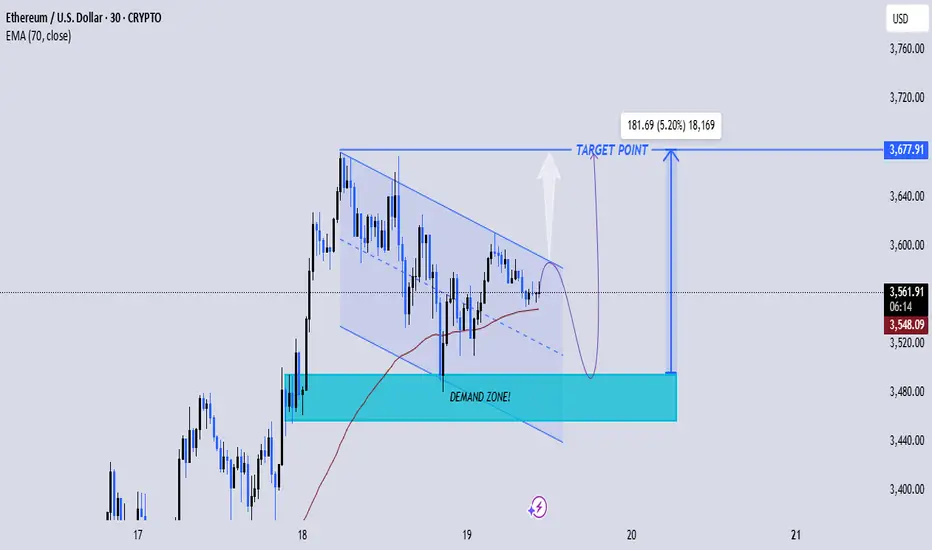
🔹 EMA Strategy: Price is hovering near the 70 EMA (3,548.11), acting as dynamic support.
🔹 Demand Zone: Strong support zone around 3,470–3,490, previously respected by buyers.
🔹 Price Action: Consolidation with lower highs & higher lows signals compression before breakout.
🔹 Volume Strategy: Low during consolidation, expected surge on breakout.
🔹 Target: Projected breakout to 3,677.91 (+5.2%) if price respects demand and breaks wedge.
✅ Strategy Suggestion:
Buy setup: If price retests demand zone & forms bullish candle → target 3,677
Confirmation: Breakout above wedge & EMA with strong volume
📈 Bullish bias while price holds above demand zone and 70 EMA
❗Watch for false breakout traps near wedge resistance
🔹 Pattern: Descending wedge – a bullish reversal pattern.
🔹 EMA Strategy: Price is hovering near the 70 EMA (3,548.11), acting as dynamic support.
🔹 Demand Zone: Strong support zone around 3,470–3,490, previously respected by buyers.
🔹 Price Action: Consolidation with lower highs & higher lows signals compression before breakout.
🔹 Volume Strategy: Low during consolidation, expected surge on breakout.
🔹 Target: Projected breakout to 3,677.91 (+5.2%) if price respects demand and breaks wedge.
✅ Strategy Suggestion:
Buy setup: If price retests demand zone & forms bullish candle → target 3,677
Confirmation: Breakout above wedge & EMA with strong volume
📈 Bullish bias while price holds above demand zone and 70 EMA
❗Watch for false breakout traps near wedge resistance
トレード終了: 利益確定目標に到達
ノート
amazing flying fighters hit our target enjoy your big big profits and send me feedbackjoin my tellegram channel
t.me/JaMesGoldFiGhteR786
join my refferal broker
one.exnesstrack.org/a/g565sj1uo7?source=app
t.me/JaMesGoldFiGhteR786
join my refferal broker
one.exnesstrack.org/a/g565sj1uo7?source=app
免責事項
これらの情報および投稿は、TradingViewが提供または保証する金融、投資、取引、またはその他の種類のアドバイスや推奨を意図したものではなく、またそのようなものでもありません。詳しくは利用規約をご覧ください。
join my tellegram channel
t.me/JaMesGoldFiGhteR786
join my refferal broker
one.exnesstrack.org/a/g565sj1uo7?source=app
t.me/JaMesGoldFiGhteR786
join my refferal broker
one.exnesstrack.org/a/g565sj1uo7?source=app
免責事項
これらの情報および投稿は、TradingViewが提供または保証する金融、投資、取引、またはその他の種類のアドバイスや推奨を意図したものではなく、またそのようなものでもありません。詳しくは利用規約をご覧ください。