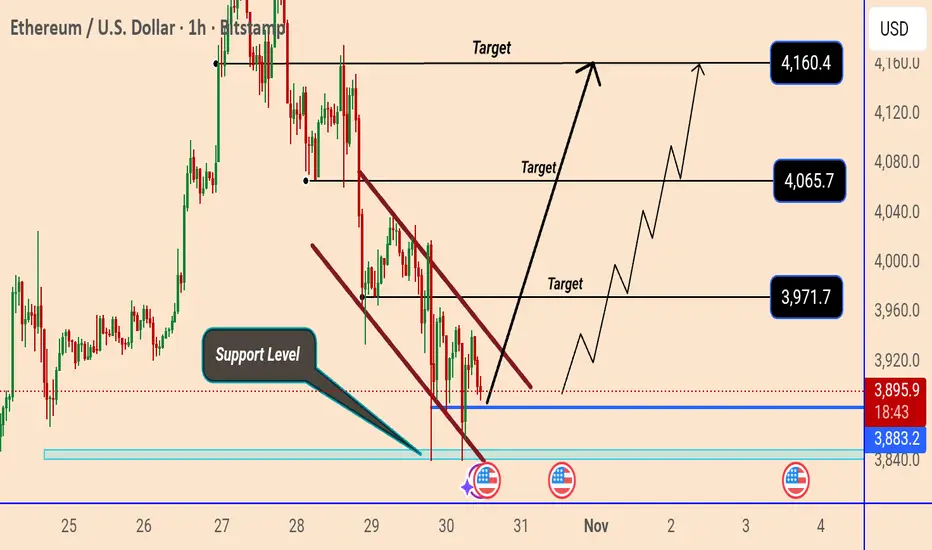
This chart shows Ethereum (ETH/USD) forming a descending channel approaching a strong support level around $3,883. A potential breakout from the downtrend is expected, targeting successive resistance levels at $3,971.7, $4,065.7, and $4,160.4. The analysis suggests a bullish reversal if the support holds and price breaks above the channel.
🎯XAUUSD GOLD BTCUSD Daily 3-5 Free Signals 🚀📊 join Telegram channel
t.me/Gold_blue_pipshunter
t.me/Gold_blue_pipshunter
免責事項
これらの情報および投稿は、TradingViewが提供または保証する金融、投資、取引、またはその他の種類のアドバイスや推奨を意図したものではなく、またそのようなものでもありません。詳しくは利用規約をご覧ください。
🎯XAUUSD GOLD BTCUSD Daily 3-5 Free Signals 🚀📊 join Telegram channel
t.me/Gold_blue_pipshunter
t.me/Gold_blue_pipshunter
免責事項
これらの情報および投稿は、TradingViewが提供または保証する金融、投資、取引、またはその他の種類のアドバイスや推奨を意図したものではなく、またそのようなものでもありません。詳しくは利用規約をご覧ください。