Hey, I am back with another Idea.
This time looking at Ethereum. Last time I gave strong buy signal at 487 dollars, and we are now at 690 now.
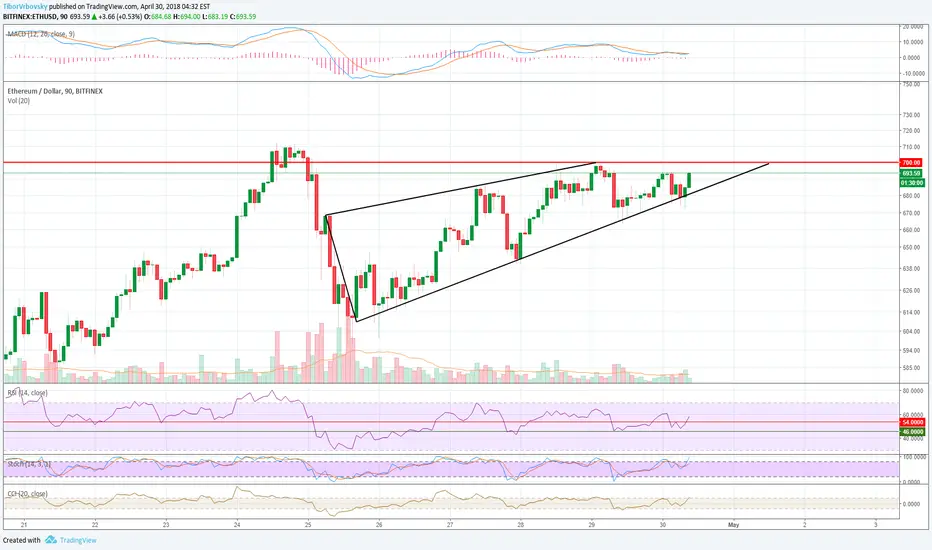
So far Ethereum had pretty nice run up, since it was way oversold.
Currently looking at the chart.
There is a wedge that is about to break.
Wedges can break both sides up or down, and I cannot be sure which way it will be, but lets take a look at the Indicators and see which way has more chance then another.
Indicators.
RSI looking good and showing clear support levels, level between 54 and 46 is being undecisive, if ETH will break upwards like it did now, its a good bullish sign. If falls below negative price action should be ahead.
MACD - is quiet before the storm will come, showing small buy signal.
Stoch is pointing upwards.
Volume is same as MACD, quiet before the storm.
I think thats about it.
Hope I made your view on whats going on with Ethereum somehow clearer.
If you like this TA let me know in the comments, Likes are aprreciated, Thanks !
If this gets a little bit of attention, I will update.
This time looking at Ethereum. Last time I gave strong buy signal at 487 dollars, and we are now at 690 now.
So far Ethereum had pretty nice run up, since it was way oversold.
Currently looking at the chart.
There is a wedge that is about to break.
Wedges can break both sides up or down, and I cannot be sure which way it will be, but lets take a look at the Indicators and see which way has more chance then another.
Indicators.
RSI looking good and showing clear support levels, level between 54 and 46 is being undecisive, if ETH will break upwards like it did now, its a good bullish sign. If falls below negative price action should be ahead.
MACD - is quiet before the storm will come, showing small buy signal.
Stoch is pointing upwards.
Volume is same as MACD, quiet before the storm.
I think thats about it.
Hope I made your view on whats going on with Ethereum somehow clearer.
If you like this TA let me know in the comments, Likes are aprreciated, Thanks !
If this gets a little bit of attention, I will update.
ノート
ノート
Yup, ascending wedge that often leads to breakdown.ノート
関連の投稿
免責事項
これらの情報および投稿は、TradingViewが提供または保証する金融、投資、取引、またはその他の種類のアドバイスや推奨を意図したものではなく、またそのようなものでもありません。詳しくは利用規約をご覧ください。
免責事項
これらの情報および投稿は、TradingViewが提供または保証する金融、投資、取引、またはその他の種類のアドバイスや推奨を意図したものではなく、またそのようなものでもありません。詳しくは利用規約をご覧ください。