Fetch.ai (FET) Chart Analysis: Observing a Bullish Pennant Break
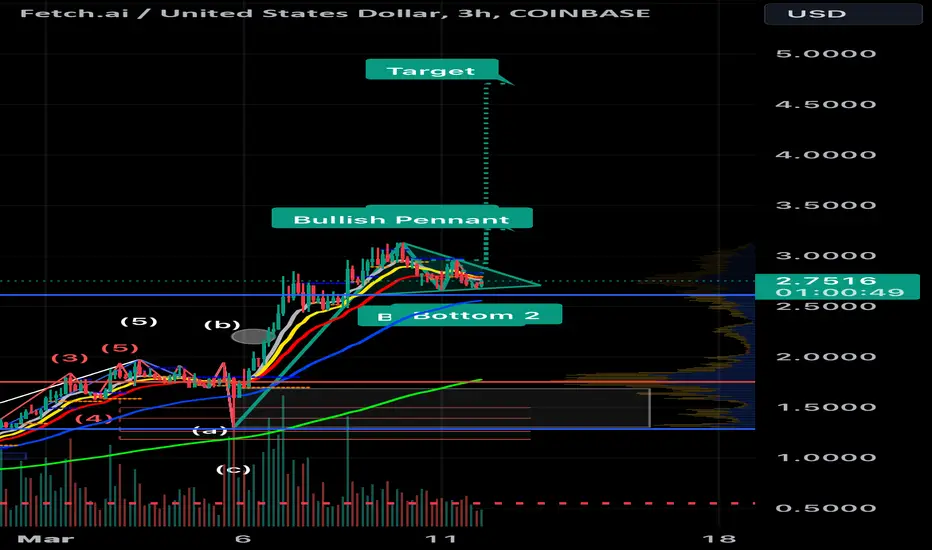
The FET/USD 3-hour chart displays a pattern resembling a bullish pennant breakout. If this breakout is confirmed, technical analysis suggests a potential price target of $4.71.
トレード稼働中
ノート
Sometimes patterns morph into new patternsノート
New pattern same targetノート
ノート
ノート
Another new ATHノート
Agix and ocean are planning to merge with FetchAi.ノート
ノート
Bull markets are fun. Its meme and AI season.ノート
トレード稼働中
ノート
There is lots of fud coming out regarding the agix, ocean, fetchai token consolidation. I’m just gonna double down on fet at the equilibrium around $2 if it falls there.ノート
ノート
I just can’t see a big correction just yet.トレード稼働中
トレード稼働中
ノート
Stop loss at $2.79.トレード終了: ストップロスに到達
トレード稼働中
Strong bullish divergence on all time framesUSDT: 0xd3787d843Cf915E5475119459B34b6429827c297
免責事項
これらの情報および投稿は、TradingViewが提供または保証する金融、投資、取引、またはその他の種類のアドバイスや推奨を意図したものではなく、またそのようなものでもありません。詳しくは利用規約をご覧ください。
USDT: 0xd3787d843Cf915E5475119459B34b6429827c297
免責事項
これらの情報および投稿は、TradingViewが提供または保証する金融、投資、取引、またはその他の種類のアドバイスや推奨を意図したものではなく、またそのようなものでもありません。詳しくは利用規約をご覧ください。