📊 Current Context
The share has been moderately positive over the past month (~+5–8% gains) in recent price data.
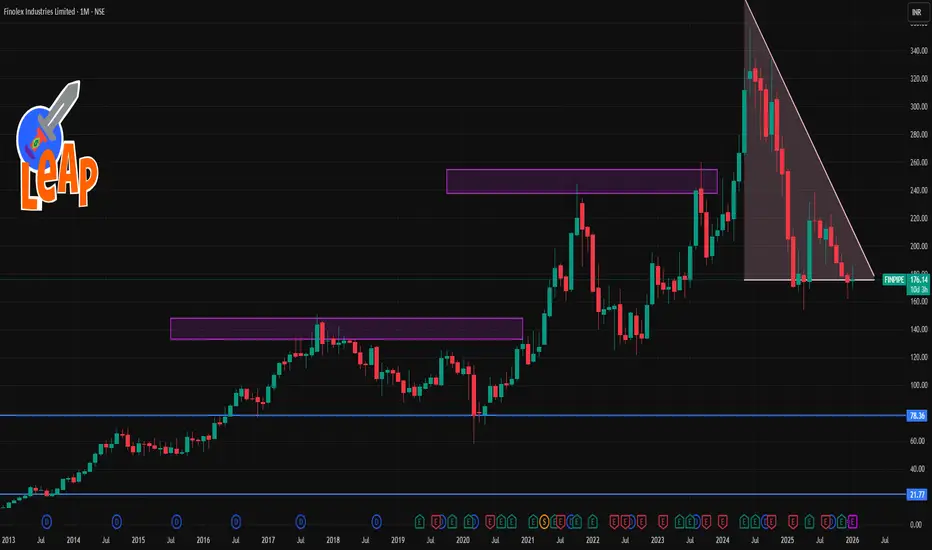
Recent share price (late Jan 2026) is near ₹175–177 levels.
📈 Key Levels (1‑Month Timeframe)
🔹 Resistance Levels
These are levels where the price may face selling pressure:
1. ~₹177–179 — Immediate resistance seen on short‑term pivot structure.
2. ~₹185–189 — Next meaningful resistance zone based on recent moving average clusters (20–50 day EMAs/SMAs).
3. ~₹194–198 — Higher resistance around 50–100 day average / upper consolidation of the last month/quarter.
Break above ₹185–189 with volume could signal a stronger short‑term uptrend continuation.
🔻 Support Levels
Important price floors where the price may find buyers:
1. ~₹173–175 — Near short‑term support and recent intraday pivot levels.
2. ~₹169–170 — Lower support seen from short swing lows over the past month.
3. ~₹164–165 — Deeper support from prior month low levels before recent recovery. (Estimated from recent historical lows.)
A close below ~₹169 on daily charts could indicate weakening short‑term structure.
🗺️ Trading Mindset (not financial advice)
Bullish view: A sustained move above ₹185–189 with increased volumes may target higher resistance near ₹195+.
Bearish view: A close under ₹170–169 could restart short‑term weakness toward lower support levels.
The share has been moderately positive over the past month (~+5–8% gains) in recent price data.
Recent share price (late Jan 2026) is near ₹175–177 levels.
📈 Key Levels (1‑Month Timeframe)
🔹 Resistance Levels
These are levels where the price may face selling pressure:
1. ~₹177–179 — Immediate resistance seen on short‑term pivot structure.
2. ~₹185–189 — Next meaningful resistance zone based on recent moving average clusters (20–50 day EMAs/SMAs).
3. ~₹194–198 — Higher resistance around 50–100 day average / upper consolidation of the last month/quarter.
Break above ₹185–189 with volume could signal a stronger short‑term uptrend continuation.
🔻 Support Levels
Important price floors where the price may find buyers:
1. ~₹173–175 — Near short‑term support and recent intraday pivot levels.
2. ~₹169–170 — Lower support seen from short swing lows over the past month.
3. ~₹164–165 — Deeper support from prior month low levels before recent recovery. (Estimated from recent historical lows.)
A close below ~₹169 on daily charts could indicate weakening short‑term structure.
🗺️ Trading Mindset (not financial advice)
Bullish view: A sustained move above ₹185–189 with increased volumes may target higher resistance near ₹195+.
Bearish view: A close under ₹170–169 could restart short‑term weakness toward lower support levels.
関連の投稿
免責事項
この情報および投稿は、TradingViewが提供または推奨する金融、投資、トレード、その他のアドバイスや推奨を意図するものではなく、それらを構成するものでもありません。詳細は利用規約をご覧ください。
関連の投稿
免責事項
この情報および投稿は、TradingViewが提供または推奨する金融、投資、トレード、その他のアドバイスや推奨を意図するものではなく、それらを構成するものでもありません。詳細は利用規約をご覧ください。