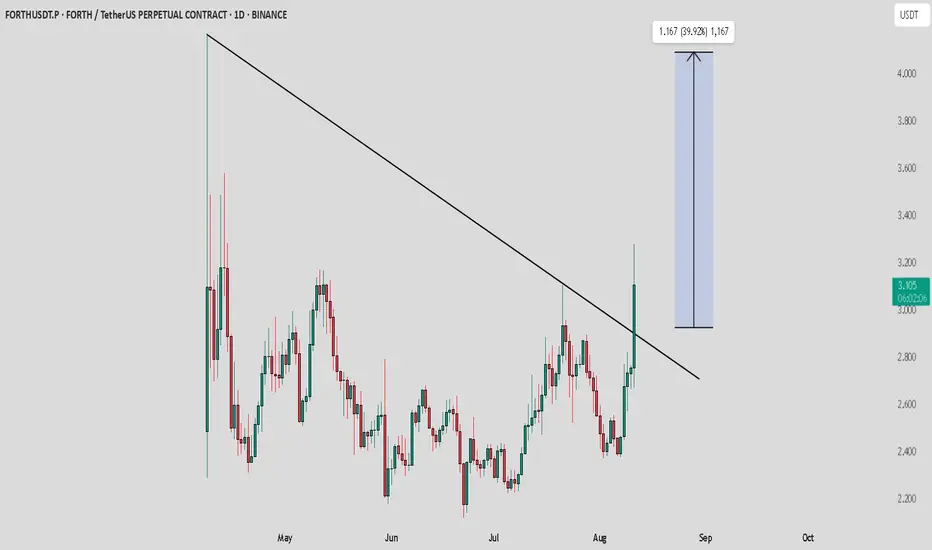
FORTH has successfully broken out of a multi-month descending triangle pattern on the daily chart. This breakout is a significant development, as the price had been consolidating and forming lower highs since May.
The recent strong bullish candle has closed above the upper trendline of the triangle, confirming the breakout. The measured move target for this pattern is indicated on the chart, pointing towards a potential price target of around $4.10.
Key Points:
* Breakout Confirmed: The daily close above the descending trendline validates the bullish move.
* Target: The measured move suggests a potential target of $4.10, which would represent a substantial gain from the current level.
* Support: The previous resistance trendline should now act as a support level. Any retest of this line could be seen as a buying opportunity.
This breakout indicates a potential shift in momentum from bearish consolidation to a new bullish trend.
Consistent setups📈. Clear entries.
Join the Telegram family for exclusive calls : 👇
[ t.me/CryptoPrime18 ]
Join the Telegram family for exclusive calls : 👇
[ t.me/CryptoPrime18 ]
免責事項
この情報および投稿は、TradingViewが提供または推奨する金融、投資、トレード、その他のアドバイスや推奨を意図するものではなく、それらを構成するものでもありません。詳細は利用規約をご覧ください。
Consistent setups📈. Clear entries.
Join the Telegram family for exclusive calls : 👇
[ t.me/CryptoPrime18 ]
Join the Telegram family for exclusive calls : 👇
[ t.me/CryptoPrime18 ]
免責事項
この情報および投稿は、TradingViewが提供または推奨する金融、投資、トレード、その他のアドバイスや推奨を意図するものではなく、それらを構成するものでもありません。詳細は利用規約をご覧ください。