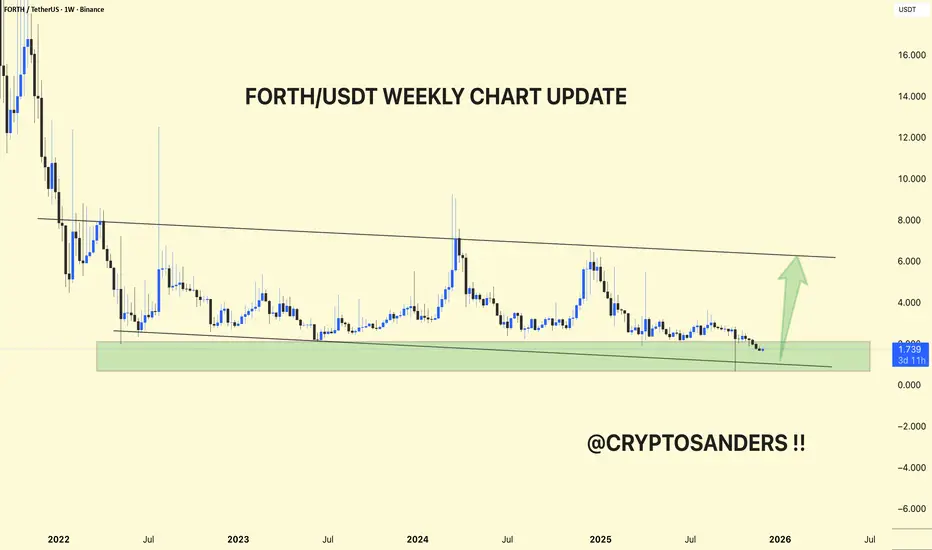
The weekly chart, FORTH/USDT, is still in a prolonged downtrend, but is once again within a large demand zone where previous rallies originated.
The price has been trending down below a major downward resistance line since 2022, with each upward impulse failing near that trendline and then retracing back to the same green support band around 1.4–2.0 USDT.
The latest candles have been holding within this green zone and the slightly rising underlying trendline, making this area a key higher-timeframe accumulation and invalidation zone for the pair.
As long as green support holds, a technical bounce towards downward resistance near 5–6 USDT remains a realistic medium-term scenario, matching the upward arrow on your chart.
A clean weekly close below the green band would break the multi-year base and create room for new lows, so risk on any long bias should be strictly managed below that zone.
DYOR | NFA
関連の投稿
免責事項
この情報および投稿は、TradingViewが提供または推奨する金融、投資、トレード、その他のアドバイスや推奨を意図するものではなく、それらを構成するものでもありません。詳細は利用規約をご覧ください。
関連の投稿
免責事項
この情報および投稿は、TradingViewが提供または推奨する金融、投資、トレード、その他のアドバイスや推奨を意図するものではなく、それらを構成するものでもありません。詳細は利用規約をご覧ください。