📊 Key Technical Indicators
Relative Strength Index (RSI): Approximately 58.89, indicating a neutral to bullish momentum.
Moving Average Convergence Divergence (MACD): Around 0.58, suggesting a bullish trend.
Simple Moving Averages (SMA):
5-Day: ₹179.11
50-Day: ₹177.17
200-Day: ₹177.3
These values indicate a bullish sentiment, as the stock is trading above these averages.
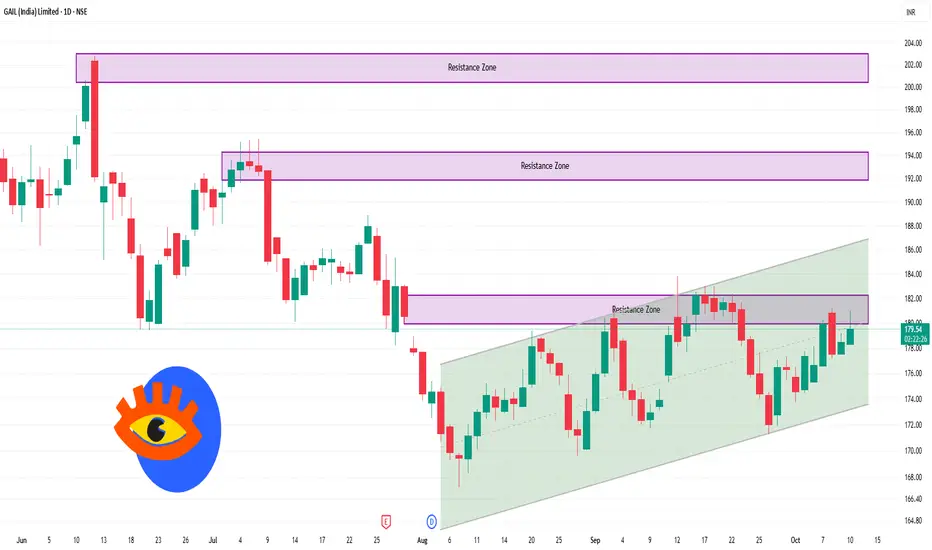
📈 Support and Resistance Levels
Immediate Support: ₹177.20
Immediate Resistance: ₹182.50
A breakout above ₹182.50 could signal a continuation of the uptrend, while a fall below ₹177.20 might indicate a bearish reversal.
🧭 Summary
GAIL (India) Ltd. is currently in a neutral to bullish phase on the daily chart. Key indicators like RSI and MACD support this outlook, and the ascending triangle pattern suggests potential upward momentum. However, traders should monitor the support and resistance levels closely to assess the next move.
Relative Strength Index (RSI): Approximately 58.89, indicating a neutral to bullish momentum.
Moving Average Convergence Divergence (MACD): Around 0.58, suggesting a bullish trend.
Simple Moving Averages (SMA):
5-Day: ₹179.11
50-Day: ₹177.17
200-Day: ₹177.3
These values indicate a bullish sentiment, as the stock is trading above these averages.
📈 Support and Resistance Levels
Immediate Support: ₹177.20
Immediate Resistance: ₹182.50
A breakout above ₹182.50 could signal a continuation of the uptrend, while a fall below ₹177.20 might indicate a bearish reversal.
🧭 Summary
GAIL (India) Ltd. is currently in a neutral to bullish phase on the daily chart. Key indicators like RSI and MACD support this outlook, and the ascending triangle pattern suggests potential upward momentum. However, traders should monitor the support and resistance levels closely to assess the next move.
関連の投稿
免責事項
これらの情報および投稿は、TradingViewが提供または保証する金融、投資、取引、またはその他の種類のアドバイスや推奨を意図したものではなく、またそのようなものでもありません。詳しくは利用規約をご覧ください。
関連の投稿
免責事項
これらの情報および投稿は、TradingViewが提供または保証する金融、投資、取引、またはその他の種類のアドバイスや推奨を意図したものではなく、またそのようなものでもありません。詳しくは利用規約をご覧ください。