📉 1-Month Performance
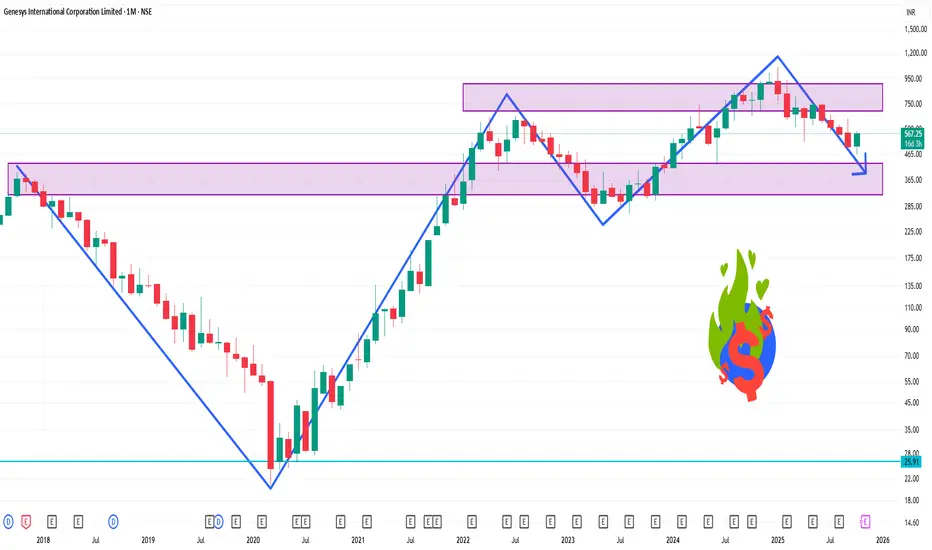
Price Change: The stock has declined by approximately 15.81% over the past month.
INDmoney
Recent Trend: Despite the monthly decline, the stock experienced a significant uptick today, closing at ₹575.55, up from ₹479.65.
📊 Technical Indicators (1-Month View)
Relative Strength Index (RSI): The RSI is at 23.10, indicating that the stock is in the oversold territory and may be due for a rebound.
Moving Averages
20-Day Exponential Moving Average (EMA): ₹526.60 (suggests a sell signal as the current price is below this level).
50-Day EMA: ₹565.84 (also indicates a sell signal).
100-Day EMA: ₹608.98 (further confirming the downtrend).
MACD: The Moving Average Convergence Divergence (MACD) is at -28.90, suggesting a bearish trend.
Pivot Points:
Resistance Levels: R1: ₹491.28, R2: ₹505.12, R3: ₹513.33.
Support Levels: S1: ₹469.23, S2: ₹461.02, S3: ₹447.18.
関連の投稿
免責事項
この情報および投稿は、TradingViewが提供または推奨する金融、投資、トレード、その他のアドバイスや推奨を意図するものではなく、それらを構成するものでもありません。詳細は利用規約をご覧ください。
関連の投稿
免責事項
この情報および投稿は、TradingViewが提供または推奨する金融、投資、トレード、その他のアドバイスや推奨を意図するものではなく、それらを構成するものでもありません。詳細は利用規約をご覧ください。