1. Price Structure
Previous trend: Gold has been in a strong uptrend since late August, consistently forming higher highs and higher lows.
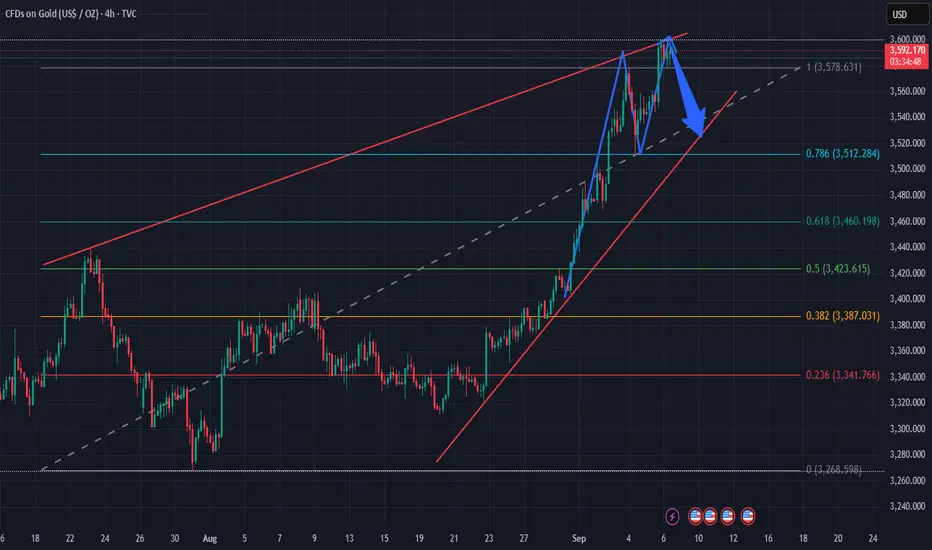
Currently, price has reached the upper channel resistance (red trendline) and is showing a small double-top pattern, signaling potential weakness.
2. Fibonacci & Support Levels
Fibonacci retracement drawn from 3,268 → 3,590.
Key levels:
0.786 = 3,510 (aligned with lower trendline → strong support).
0.618 = 3,460 → medium-term support.
0.382 = 3,380 → if broken, short-term bullish structure weakens.
3. Patterns & Technical Signals
The chart indicates a blue arrow: expectation of a pullback from 3,590 toward around 3,520 (grey trendline + 0.786 Fibo).
If price holds above 3,510 → potential rebound to continue the uptrend.
If 3,510 breaks → deeper correction likely toward 3,460 – 3,420.
4. Trading Scenarios
Scenario 1 (preferred):
Short-term sell from 3,590 → 3,520.
TP: 3,520 – 3,510, SL above 3,600.
Scenario 2:
If 3,510 – 3,520 holds strong → consider long entries in line with the main trend.
TP: 3,590 → 3,620, SL below 3,490.
👉 Summary: Gold is showing short-term weakness after a sharp rally, likely to correct toward 3,510 – 3,520 before the next move becomes clearer.
Previous trend: Gold has been in a strong uptrend since late August, consistently forming higher highs and higher lows.
Currently, price has reached the upper channel resistance (red trendline) and is showing a small double-top pattern, signaling potential weakness.
2. Fibonacci & Support Levels
Fibonacci retracement drawn from 3,268 → 3,590.
Key levels:
0.786 = 3,510 (aligned with lower trendline → strong support).
0.618 = 3,460 → medium-term support.
0.382 = 3,380 → if broken, short-term bullish structure weakens.
3. Patterns & Technical Signals
The chart indicates a blue arrow: expectation of a pullback from 3,590 toward around 3,520 (grey trendline + 0.786 Fibo).
If price holds above 3,510 → potential rebound to continue the uptrend.
If 3,510 breaks → deeper correction likely toward 3,460 – 3,420.
4. Trading Scenarios
Scenario 1 (preferred):
Short-term sell from 3,590 → 3,520.
TP: 3,520 – 3,510, SL above 3,600.
Scenario 2:
If 3,510 – 3,520 holds strong → consider long entries in line with the main trend.
TP: 3,590 → 3,620, SL below 3,490.
👉 Summary: Gold is showing short-term weakness after a sharp rally, likely to correct toward 3,510 – 3,520 before the next move becomes clearer.
✅MY FREE FOREX & XAUUSD SIGNALS TELEGRAM CHANNEL:
t.me/+xkPoUfOB8BsyMzRl
🔴9-12 signals per day
🔴Free knowledge support
🔴24/7 support for newbies.
🔴You always have priority.
FXWARRIOR 😘
t.me/+xkPoUfOB8BsyMzRl
🔴9-12 signals per day
🔴Free knowledge support
🔴24/7 support for newbies.
🔴You always have priority.
FXWARRIOR 😘
関連の投稿
免責事項
この情報および投稿は、TradingViewが提供または推奨する金融、投資、トレード、その他のアドバイスや推奨を意図するものではなく、それらを構成するものでもありません。詳細は利用規約をご覧ください。