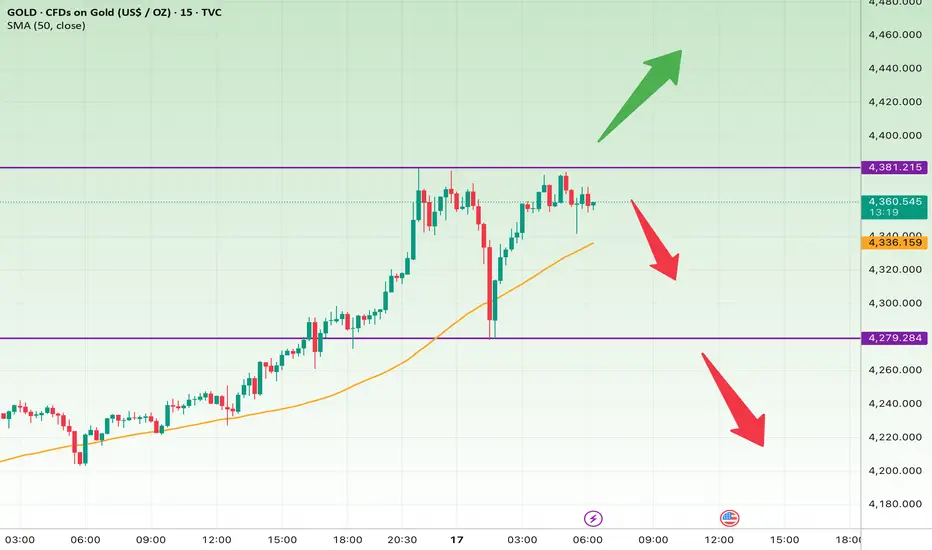
On the 15-minute gold chart, price is testing the key resistance around $4,381. This level has acted as a ceiling several times, suggesting strong selling pressure. The 50-period SMA at $4,234 still supports the broader uptrend, but momentum appears to be weakening near resistance.
In the short term, a close below $4,340 could trigger a pullback toward $4,280 and possibly $4,240. A reasonable stop loss for this scenario is above $4,385.
In the longer-term view (over the next few sessions), if gold breaks and sustains above $4,381, we could see an upside move toward $4,400 and $4,460. The protective stop for this bullish setup should be below $4,275.
Overall, gold is at a decision point — a breakout could signal continuation of the bullish wave, while rejection from resistance may lead to a short-term correction.
免責事項
これらの情報および投稿は、TradingViewが提供または保証する金融、投資、取引、またはその他の種類のアドバイスや推奨を意図したものではなく、またそのようなものでもありません。詳しくは利用規約をご覧ください。
免責事項
これらの情報および投稿は、TradingViewが提供または保証する金融、投資、取引、またはその他の種類のアドバイスや推奨を意図したものではなく、またそのようなものでもありません。詳しくは利用規約をご覧ください。