🔎 Technical Analysis
Main Trend:
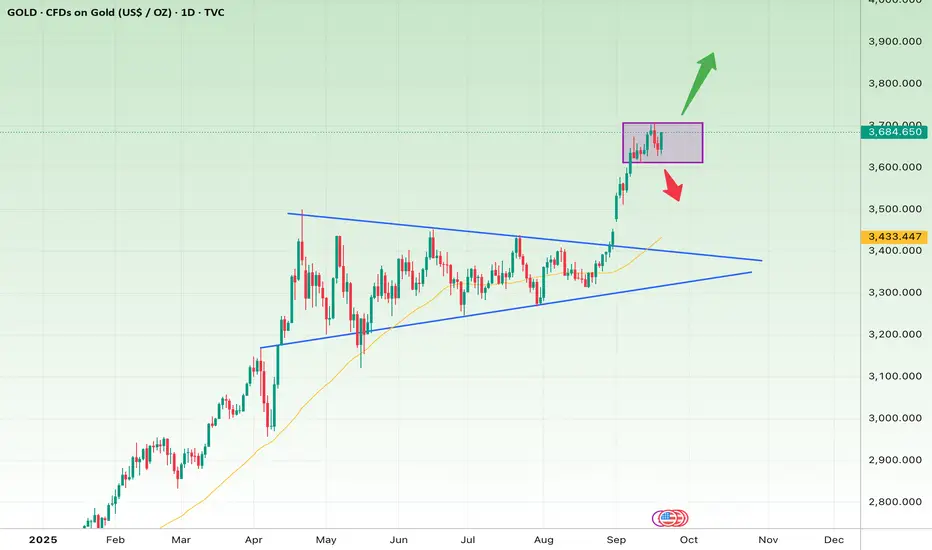
Since early 2025, gold has been in a strong uptrend. The breakout from the symmetrical triangle in September was decisive, with strong momentum, pushing the price quickly above $3,600.
Current Situation:
Price is now consolidating in a range box ($3,630–$3,700). This is a healthy pause after the sharp rally, serving as an accumulation zone before the next major move.
Indicators & Signals:
The 50-day MA (yellow) is acting as dynamic support.
Bullish candles are larger and more frequent than bearish ones → buyers remain in control.
However, a short-term pullback to retest lower supports is still possible.
📈 Short-Term Outlook (1–3 weeks)
Bullish Scenario (more likely):
A breakout above $3,700 could fuel another rally toward $3,780 – $3,850.
Stop-loss: Close below $3,620.
Bearish Scenario (less likely):
A breakdown below $3,620 could trigger a correction down to $3,480 – $3,430 (confluence with the 50-day MA and the broken triangle top).
Stop-loss for shorts: Above $3,700.
📊 Long-Term Outlook (2–4 months)
The overall structure remains bullish, with the triangle breakout still in play.
As long as price holds above $3,430, the long-term uptrend is intact.
Key targets:
First target: $3,900 (psychological level)
Second target: $4,200 (technical projection from the triangle pattern)
Long-term stop-loss: A sustained close below $3,300 would invalidate the bullish outlook.
✅ Summary:
Short-term: The key level is $3,700. A breakout above confirms continuation, while a drop below $3,620 signals a correction.
Long-term: Trend is bullish as long as price stays above $3,430, with $4,200 as a realistic upside target.
Main Trend:
Since early 2025, gold has been in a strong uptrend. The breakout from the symmetrical triangle in September was decisive, with strong momentum, pushing the price quickly above $3,600.
Current Situation:
Price is now consolidating in a range box ($3,630–$3,700). This is a healthy pause after the sharp rally, serving as an accumulation zone before the next major move.
Indicators & Signals:
The 50-day MA (yellow) is acting as dynamic support.
Bullish candles are larger and more frequent than bearish ones → buyers remain in control.
However, a short-term pullback to retest lower supports is still possible.
📈 Short-Term Outlook (1–3 weeks)
Bullish Scenario (more likely):
A breakout above $3,700 could fuel another rally toward $3,780 – $3,850.
Stop-loss: Close below $3,620.
Bearish Scenario (less likely):
A breakdown below $3,620 could trigger a correction down to $3,480 – $3,430 (confluence with the 50-day MA and the broken triangle top).
Stop-loss for shorts: Above $3,700.
📊 Long-Term Outlook (2–4 months)
The overall structure remains bullish, with the triangle breakout still in play.
As long as price holds above $3,430, the long-term uptrend is intact.
Key targets:
First target: $3,900 (psychological level)
Second target: $4,200 (technical projection from the triangle pattern)
Long-term stop-loss: A sustained close below $3,300 would invalidate the bullish outlook.
✅ Summary:
Short-term: The key level is $3,700. A breakout above confirms continuation, while a drop below $3,620 signals a correction.
Long-term: Trend is bullish as long as price stays above $3,430, with $4,200 as a realistic upside target.
免責事項
この情報および投稿は、TradingViewが提供または推奨する金融、投資、トレード、その他のアドバイスや推奨を意図するものではなく、それらを構成するものでもありません。詳細は利用規約をご覧ください。
免責事項
この情報および投稿は、TradingViewが提供または推奨する金融、投資、トレード、その他のアドバイスや推奨を意図するものではなく、それらを構成するものでもありません。詳細は利用規約をご覧ください。