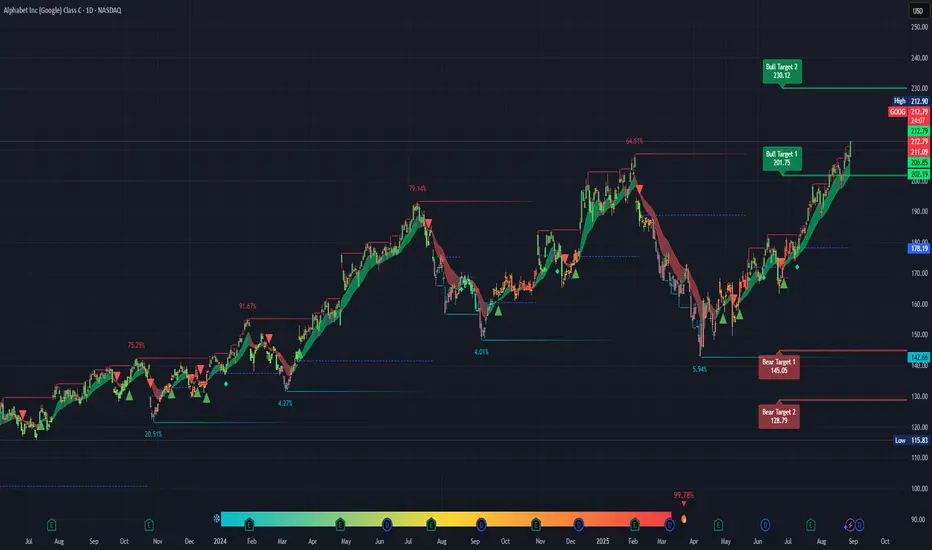
Strong Trend: Price has been pushing higher since April 2025, with higher highs and higher lows intact. The green zone shows momentum is with the bulls.
Breakout Attempt: You’re sitting near recent highs around 212.90, which shows buyers are in control. If it clears that resistance cleanly, Bull Target 1 (201.75) is already hit, and Target 2 (230.12) is in play.
Volume Uptick: Volume looks supportive of the breakout move (12.61M shown). More buyers stepping in usually confirms the move.
⚠️ Concerns (Why It Might Fail)
Overextended Run: The stock has already run ~40+% since April. Moves like this often see consolidation or pullbacks before the next leg.
Bear Targets Still in Play: If the breakout fails, your downside risk is real: 142.66 → 145.05 (Bear Target 1), and possibly 128.79 (Bear Target 2). That’s a nasty ~30–35% potential drop.
Resistance at 212.90: If it can’t close strong above here, you may get a short-term double top.
🎯 Cost vs. Benefit
Upside to Bull Target 2 (230.12): ~8% gain.
Downside to Bear Target 1 (145.05): ~32% risk.
Risk/Reward: About 1:4 against you right now unless you use a tight stop. That’s not attractive for a fresh entry.
🤔 Too Good to Be True Filter
“This chart looks like it’s going straight to 230” — probably not that easy. Expect chop and possible pullbacks around the 210–215 zone. If it does blast through with high volume, then you’ve got confirmation.
免責事項
これらの情報および投稿は、TradingViewが提供または保証する金融、投資、取引、またはその他の種類のアドバイスや推奨を意図したものではなく、またそのようなものでもありません。詳しくは利用規約をご覧ください。
免責事項
これらの情報および投稿は、TradingViewが提供または保証する金融、投資、取引、またはその他の種類のアドバイスや推奨を意図したものではなく、またそのようなものでもありません。詳しくは利用規約をご覧ください。