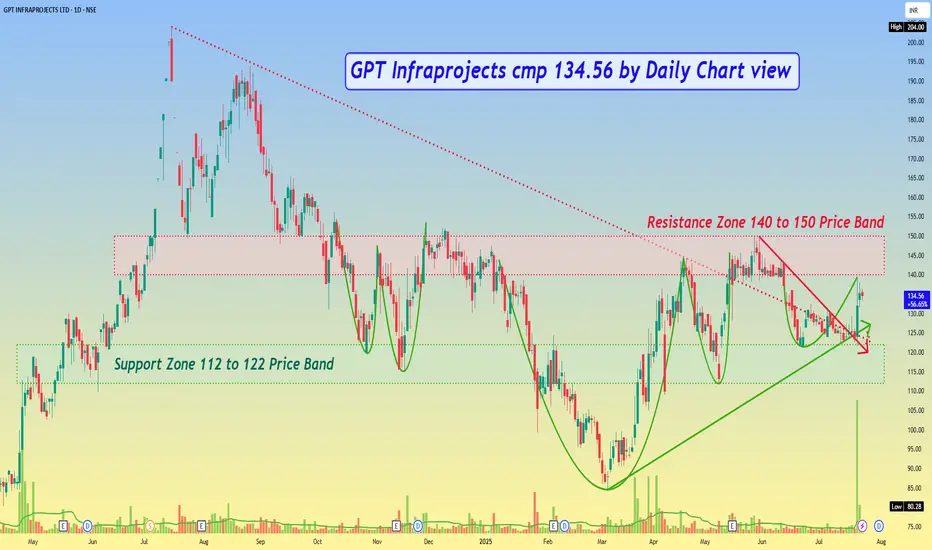
GPT Infraprojects cmp 134.56 by Daily Chart view
- Support Zone 112 to 122 Price Band
- Resistance Zone 140 to 150 Price Band
- Support Zone tested and retested well before breakout
- Falling Resistance Trendline from ATH broken and sustained
- 2nd recent Falling Resistance Trendline Breakout too seems sustained
- Heavy Volumes surged seen over past 2 days by demand based buying
- Bullish Rounding Bottoms by Resistance Zone neckline indicate upside momentum readiness
関連の投稿
免責事項
この情報および投稿は、TradingViewが提供または推奨する金融、投資、トレード、その他のアドバイスや推奨を意図するものではなく、それらを構成するものでもありません。詳細は利用規約をご覧ください。
免責事項
この情報および投稿は、TradingViewが提供または推奨する金融、投資、トレード、その他のアドバイスや推奨を意図するものではなく、それらを構成するものでもありません。詳細は利用規約をご覧ください。