A comprehensive breakdown of Hindustan Aeronautics Ltd. (HAL) based on chart + candlestick + technical + fundamental + industry-level analysis.
- Hindustan Aeronautics Ltd. (HAL) Stock Analysis
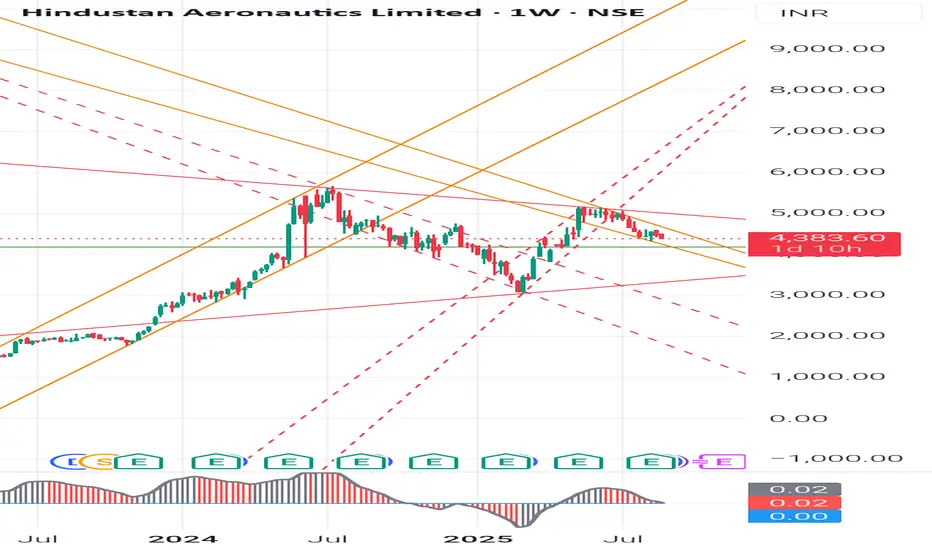
1- Candlestick Pattern Analysis (Weekly Chart)
Current Price: 4,383.6
Recent candles are showing long wicks with narrow bodies - sign of indecision between bulls and bears.
Last 4- 5 weeks - mostly lower highs and lower lows = short-term bearish bias.
No strong reversal candle yet (like hammer/bullish engulfing) - trend continuation possible unless support holds.
2- Chart Pattern Analysis
The stock is moving inside a falling channel (descending channel) from the peak of - 5,200.
This may develop into a Bullish Falling Wedge (pattern in progress).
If breakout above 4,550- 4,600 zone happens - strong rally possible.
If breakdown below 4,200 - risk of correction towards 3,800.
3- Swing Analysis
Swing High: 5,250
Swing Low: 3,400 (recent bottom in 2024)
Current swing = pullback after rejection near 4,800- 4,900 zone.
Risk-reward is favorable for long-term investors around support zones (4,200- 4,000).
4- Key Levels
Immediate Support: 4,200 - 4,000 - 3,800
Immediate Resistance: 4,550 - 4,900 - 5,250
Perfect Entry for Long (Investors): Between 4,000- 4,200 with stop loss below 3,800.
Perfect Entry for Short (Traders): Near 4,500- 4,600 zone with target 4,200.
5- Industry Analysis (Defence & Aerospace Sector)
India’s Defence sector is getting strong govt. support (Atmanirbhar Bharat, Defence production push).
HAL is a PSU monopoly in aerospace & defence manufacturing (fighter jets, helicopters, engines).
Order Book: Robust pipeline with 80,000+ crore confirmed + new export opportunities.
Primary Market: Defence PSUs (HAL, BEL, BDL, Mazagon Dock) have outperformed broader market since 2020.
Secondary Market: HAL is relatively less volatile compared to private defence companies, due to stable govt. contracts.
6- Peer Comparison (Fundamentals)
Company P/E Ratio ROE Order Book Debt-Equity EPS Growth
HAL - 33x 28% 80,000+ Cr 0.01 (Debt-Free) Strong
BEL - 41x 23% 75,000+ Cr 0.05 Good
BDL - 48x 19% 20,000+ Cr 0.03 Moderate
Mazagon Dock - 32x 26% 65,000+ Cr 0.02 High
👉 HAL has-
Stronger ROE than peers
Debt-Free balance sheet
Slightly lower P/E than BEL & BDL - fair valuation
7- Learnings for Students (Investment Perspective)
- Chart patterns matter: HAL is showing a falling wedge, which is often bullish if breakout happens.
- Fundamentals matter: A stock with strong order book, high ROE, and debt-free status is usually safer.
-Valuation check: P/E ratio must be compared with industry average before investing.
- Patience needed: Weekly charts show long-term view. Don’t panic on short-term volatility.
- Sectoral push: Govt. policy & industry growth can override short-term technical weakness.
Summary:
HAL is currently in a consolidation/correction phase, testing strong support near 4,200.
Investors: Good zone to accumulate in dips for long-term (target 5,500+ if breakout sustains).
Traders: Short-term bearish bias until weekly close above 4,550.
👉Disclaimer-
This analysis is for educational purposes only. Not a SEBI-registered advisory. Please do your own research or consult a financial advisor before investing.
#HAL #StockMarketIndia #DefenceStocks #Investing #SwingTrading #PSUStocks #StockMarketEducation #ChartAnalysis #ValueInvesting #AtmanirbharBharat
- Hindustan Aeronautics Ltd. (HAL) Stock Analysis
1- Candlestick Pattern Analysis (Weekly Chart)
Current Price: 4,383.6
Recent candles are showing long wicks with narrow bodies - sign of indecision between bulls and bears.
Last 4- 5 weeks - mostly lower highs and lower lows = short-term bearish bias.
No strong reversal candle yet (like hammer/bullish engulfing) - trend continuation possible unless support holds.
2- Chart Pattern Analysis
The stock is moving inside a falling channel (descending channel) from the peak of - 5,200.
This may develop into a Bullish Falling Wedge (pattern in progress).
If breakout above 4,550- 4,600 zone happens - strong rally possible.
If breakdown below 4,200 - risk of correction towards 3,800.
3- Swing Analysis
Swing High: 5,250
Swing Low: 3,400 (recent bottom in 2024)
Current swing = pullback after rejection near 4,800- 4,900 zone.
Risk-reward is favorable for long-term investors around support zones (4,200- 4,000).
4- Key Levels
Immediate Support: 4,200 - 4,000 - 3,800
Immediate Resistance: 4,550 - 4,900 - 5,250
Perfect Entry for Long (Investors): Between 4,000- 4,200 with stop loss below 3,800.
Perfect Entry for Short (Traders): Near 4,500- 4,600 zone with target 4,200.
5- Industry Analysis (Defence & Aerospace Sector)
India’s Defence sector is getting strong govt. support (Atmanirbhar Bharat, Defence production push).
HAL is a PSU monopoly in aerospace & defence manufacturing (fighter jets, helicopters, engines).
Order Book: Robust pipeline with 80,000+ crore confirmed + new export opportunities.
Primary Market: Defence PSUs (HAL, BEL, BDL, Mazagon Dock) have outperformed broader market since 2020.
Secondary Market: HAL is relatively less volatile compared to private defence companies, due to stable govt. contracts.
6- Peer Comparison (Fundamentals)
Company P/E Ratio ROE Order Book Debt-Equity EPS Growth
HAL - 33x 28% 80,000+ Cr 0.01 (Debt-Free) Strong
BEL - 41x 23% 75,000+ Cr 0.05 Good
BDL - 48x 19% 20,000+ Cr 0.03 Moderate
Mazagon Dock - 32x 26% 65,000+ Cr 0.02 High
👉 HAL has-
Stronger ROE than peers
Debt-Free balance sheet
Slightly lower P/E than BEL & BDL - fair valuation
7- Learnings for Students (Investment Perspective)
- Chart patterns matter: HAL is showing a falling wedge, which is often bullish if breakout happens.
- Fundamentals matter: A stock with strong order book, high ROE, and debt-free status is usually safer.
-Valuation check: P/E ratio must be compared with industry average before investing.
- Patience needed: Weekly charts show long-term view. Don’t panic on short-term volatility.
- Sectoral push: Govt. policy & industry growth can override short-term technical weakness.
Summary:
HAL is currently in a consolidation/correction phase, testing strong support near 4,200.
Investors: Good zone to accumulate in dips for long-term (target 5,500+ if breakout sustains).
Traders: Short-term bearish bias until weekly close above 4,550.
👉Disclaimer-
This analysis is for educational purposes only. Not a SEBI-registered advisory. Please do your own research or consult a financial advisor before investing.
#HAL #StockMarketIndia #DefenceStocks #Investing #SwingTrading #PSUStocks #StockMarketEducation #ChartAnalysis #ValueInvesting #AtmanirbharBharat
免責事項
これらの情報および投稿は、TradingViewが提供または保証する金融、投資、取引、またはその他の種類のアドバイスや推奨を意図したものではなく、またそのようなものでもありません。詳しくは利用規約をご覧ください。
免責事項
これらの情報および投稿は、TradingViewが提供または保証する金融、投資、取引、またはその他の種類のアドバイスや推奨を意図したものではなく、またそのようなものでもありません。詳しくは利用規約をご覧ください。