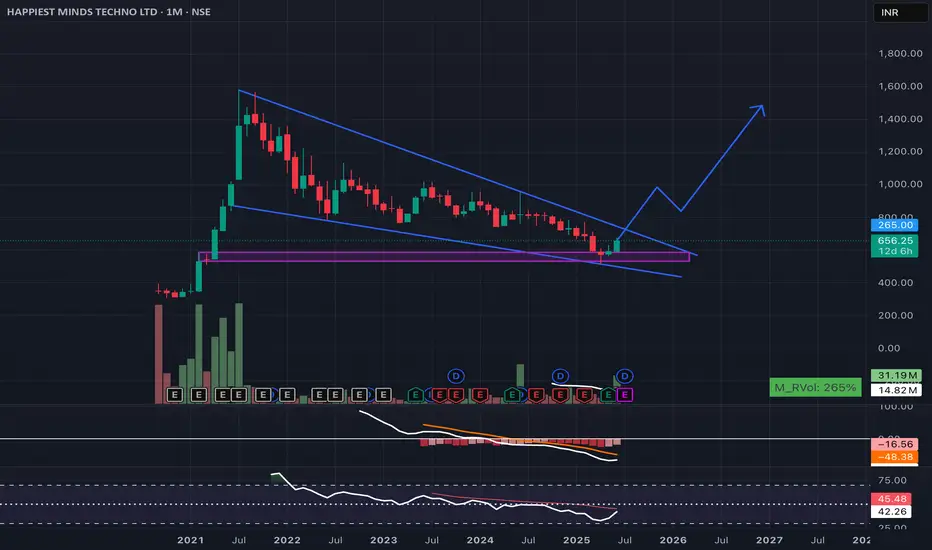
📈 HAPPIEST MINDS – Falling Wedge Breakout on Monthly Chart
Date: June 18, 2025 | Exchange: NSE | Timeframe: Monthly
Happiest Minds is showing signs of a potential long-term trend reversal. Price is breaking out of a falling wedge pattern after a multi-month downtrend, with strong bullish momentum this month (+10.47%).
Key Points:
* Pattern: Falling wedge breakout
* Volume: Spike with 265% RVOL – early accumulation
* MACD: Bearish momentum fading
* RSI: Bouncing from oversold zone
View: Long-term bullish reversal in play. Sustained close above trendline could trigger a fresh uptrend toward 1200–1500 levels in the coming quarters.
免責事項
これらの情報および投稿は、TradingViewが提供または保証する金融、投資、取引、またはその他の種類のアドバイスや推奨を意図したものではなく、またそのようなものでもありません。詳しくは利用規約をご覧ください。
免責事項
これらの情報および投稿は、TradingViewが提供または保証する金融、投資、取引、またはその他の種類のアドバイスや推奨を意図したものではなく、またそのようなものでもありません。詳しくは利用規約をご覧ください。