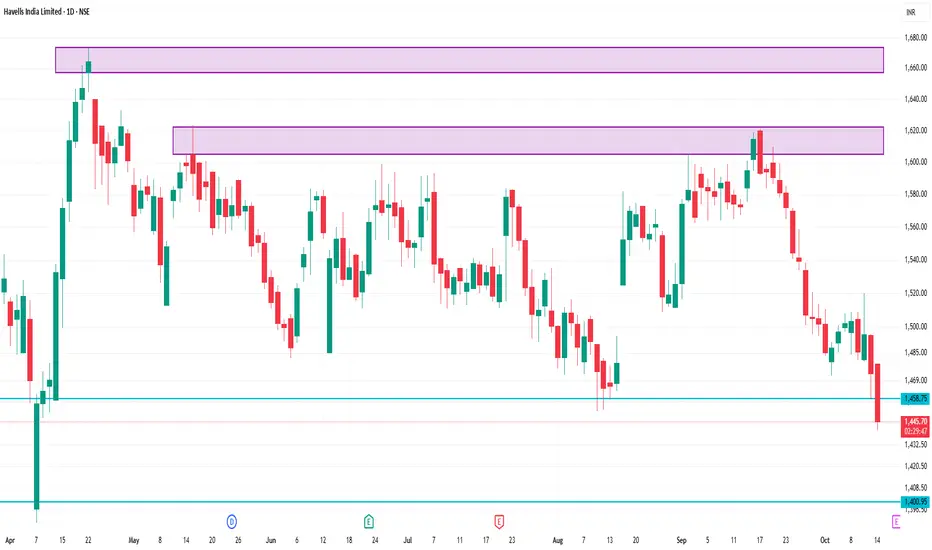
📊 Key Support and Resistance Levels
Immediate Support: ₹1,477.53
Immediate Resistance: ₹1,527.85
Short-Term Support: ₹1,497.04
Short-Term Resistance: ₹1,538.60
Fibonacci Pivot Point: ₹1,462.70
These levels are derived from standard technical analysis tools and are relevant for intraday trading strategies.
📉 Technical Indicators
Relative Strength Index (RSI): 28.62 (indicating an oversold condition)
Moving Average Convergence Divergence (MACD): -9.64 (suggesting bearish momentum)
5-Day Moving Average: ₹1,465.36
50-Day Moving Average: ₹1,490.21
200-Day Moving Average: ₹1,547.08
These indicators collectively suggest a bearish trend in the short term.
関連の投稿
免責事項
この情報および投稿は、TradingViewが提供または推奨する金融、投資、トレード、その他のアドバイスや推奨を意図するものではなく、それらを構成するものでもありません。詳細は利用規約をご覧ください。
関連の投稿
免責事項
この情報および投稿は、TradingViewが提供または推奨する金融、投資、トレード、その他のアドバイスや推奨を意図するものではなく、それらを構成するものでもありません。詳細は利用規約をご覧ください。