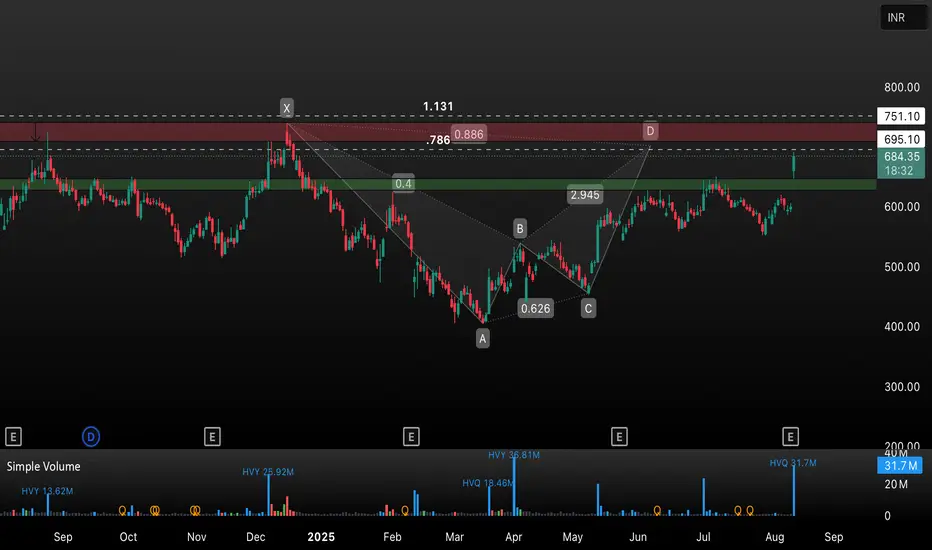
HB LENG has demonstrated a strong bullish breakout, surging over 13% and breaking past previous resistance. The chart displays a completed harmonic pattern with the price moving towards the D point zone (751 level). Key resistance lies between 695 – 751, with Fibonacci levels (.786/.886) as potential reversal zones.
Trade Insight:
• Support: 620–695 (green zone)
• Resistance: 695–751 (red zone)
• Watch for price action near the 751 zone; a breakout could trigger a fresh uptrend, while rejection may see consolidation or pullback.
• High volume confirms strong buyer interest.
Strategy:
Consider booking partial profits as price approaches resistance. Wait for confirmation before entering new positions. Ideal for swing traders watching for breakout or reversal signs.
免責事項
これらの情報および投稿は、TradingViewが提供または保証する金融、投資、取引、またはその他の種類のアドバイスや推奨を意図したものではなく、またそのようなものでもありません。詳しくは利用規約をご覧ください。
免責事項
これらの情報および投稿は、TradingViewが提供または保証する金融、投資、取引、またはその他の種類のアドバイスや推奨を意図したものではなく、またそのようなものでもありません。詳しくは利用規約をご覧ください。