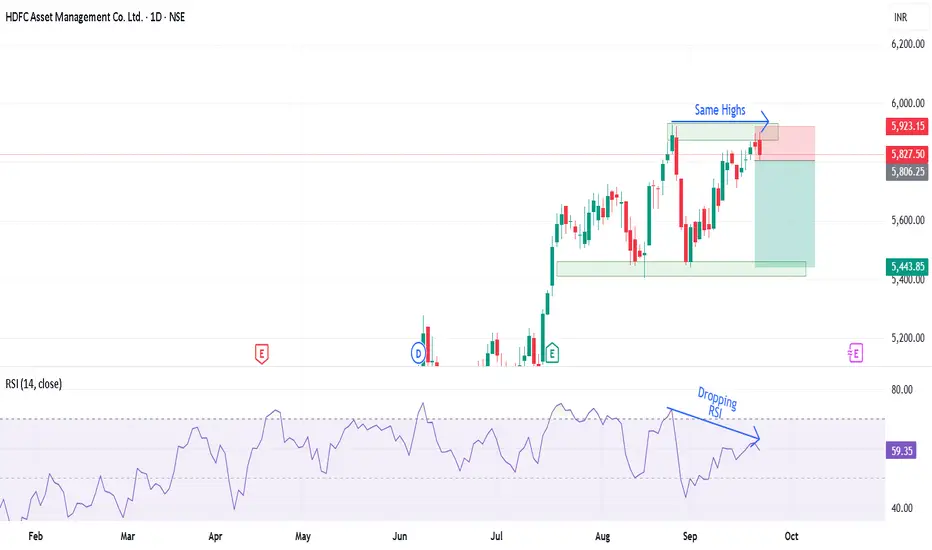
HDFC AMC has given a good upside rally of 65% and is form a double top pattern.

The stock is following a bullish trendline but the RSI divergence is creating a bearish sentiment supported by the drop India VIX.
If the stock breaks below the trendline, a bearish trade can be entered with the first target of 5440 following it to 5208.
Bullishness will only be confirmed only once the stock starts trading above 6000 levels.
There is RSI divergence on the higher time frame too and gives more convincing trade in the stock.
Entry :- Below 5809
Target :- 5440 and 5208
Stop Loss :- Close above 5927 (daily charts)
Wait for the price action and trade accordingly.
トレード稼働中
The entry has been done and now its time to hold it for the targets.
200 points are done in bearish move.
Chance are there of stock taking a halt after a 3 days fall or some profit booking.
Index is on our side and another bearish day can help us achieve our first target of 5440.
トレード終了: 利益確定目標に到達
The stock has given us our target one and there are chance of it taking a halt around the support zone.
50% position booked around first target.
Addition will be done only once the support zone is breached.
Trailing Stop Loss :- close above 5667
ノート
Another leg of the bearish move start after restesting the previous levels関連の投稿
免責事項
The information and publications are not meant to be, and do not constitute, financial, investment, trading, or other types of advice or recommendations supplied or endorsed by TradingView. Read more in the Terms of Use.
関連の投稿
免責事項
The information and publications are not meant to be, and do not constitute, financial, investment, trading, or other types of advice or recommendations supplied or endorsed by TradingView. Read more in the Terms of Use.