HDFC Bank CMP 1769
I had posted previously how this stock has turned negative on higher time frame charts. Now it is set on the daily charts as well.
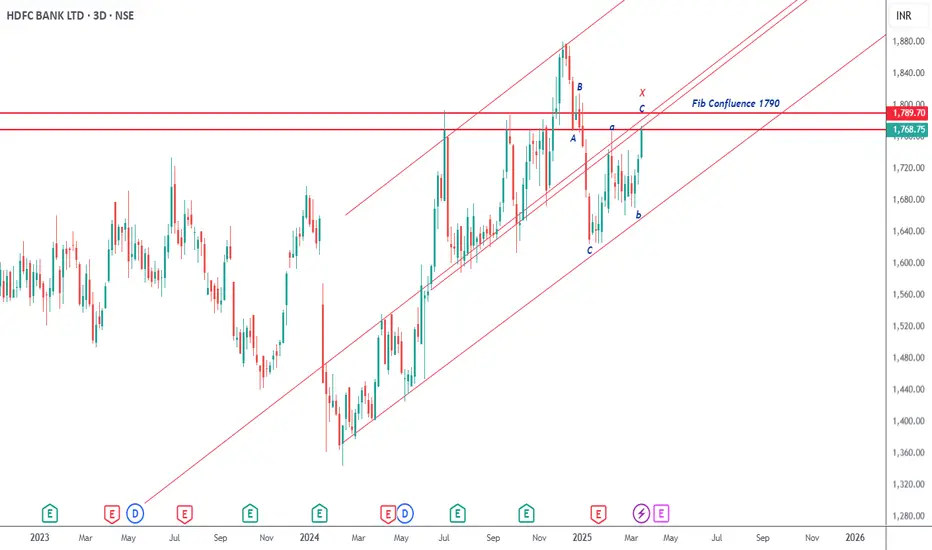
Elliott- The first correction from the highs is a bullish zig zag. It is followed by another corrective pattern which is a bearish zig zag. Hence a fresh three wave fall ABC should begin from here.
Fibs- the current zone and the next at 1769 are both fib confluence zones and hence strong resistance.
Channel - the stock is also at channel resistance as well.
Conclusion - In my view it will break the 1600 zone this time around.
I had posted previously how this stock has turned negative on higher time frame charts. Now it is set on the daily charts as well.
Elliott- The first correction from the highs is a bullish zig zag. It is followed by another corrective pattern which is a bearish zig zag. Hence a fresh three wave fall ABC should begin from here.
Fibs- the current zone and the next at 1769 are both fib confluence zones and hence strong resistance.
Channel - the stock is also at channel resistance as well.
Conclusion - In my view it will break the 1600 zone this time around.
免責事項
これらの情報および投稿は、TradingViewが提供または保証する金融、投資、取引、またはその他の種類のアドバイスや推奨を意図したものではなく、またそのようなものでもありません。詳しくは利用規約をご覧ください。
免責事項
これらの情報および投稿は、TradingViewが提供または保証する金融、投資、取引、またはその他の種類のアドバイスや推奨を意図したものではなく、またそのようなものでもありません。詳しくは利用規約をご覧ください。