Most traders jump straight into attractive chart patterns and impulsively take trades, ignoring the bigger picture. Here’s a powerful case study
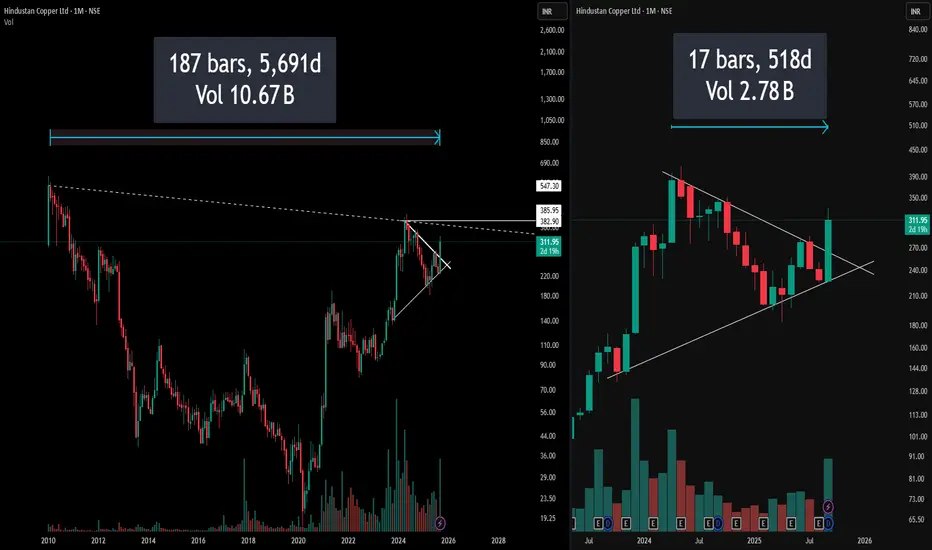
Left Side: Full Monthly Chart with Hidden Resistance
On the left, the chart captures over a decade of price action, immediately drawing attention to a long-standing downward-sloping resistance stretching from all-time highs. This hidden resistance line is not visible on the usual zoomed-in view, yet it presents a formidable barrier that traders often neglect.
(Pro Insight: Always extend trendlines and resistance zones till the inception of the instrument for real swing perspective)
(Risk Reminder: What looks like a clear breakout on a recent timeframe may actually be approaching a multi-year resistance trap)
Right Side: Symmetrical Triangle – The Pattern Focus
The right segment restricts focus to the last few years, zooming in on a visually perfect symmetrical triangle. While the setup looks neat and promising—indicating contraction and likely expansion ahead—this trimmed view risks obscuring the bigger, hidden resistance directly overhead.
Disclaimer: This post reflects technical views for educational purposes only, not investment advice. Always perform your own due diligence before trading.
🎯 Master My Self-Made Trading Strategy
📈 Telegram (Learn Today): t.me/hashtaghammer
✅ WhatsApp (Learn Today): wa.me/919455664601
📈 Telegram (Learn Today): t.me/hashtaghammer
✅ WhatsApp (Learn Today): wa.me/919455664601
関連の投稿
免責事項
この情報および投稿は、TradingViewが提供または推奨する金融、投資、トレード、その他のアドバイスや推奨を意図するものではなく、それらを構成するものでもありません。詳細は利用規約をご覧ください。