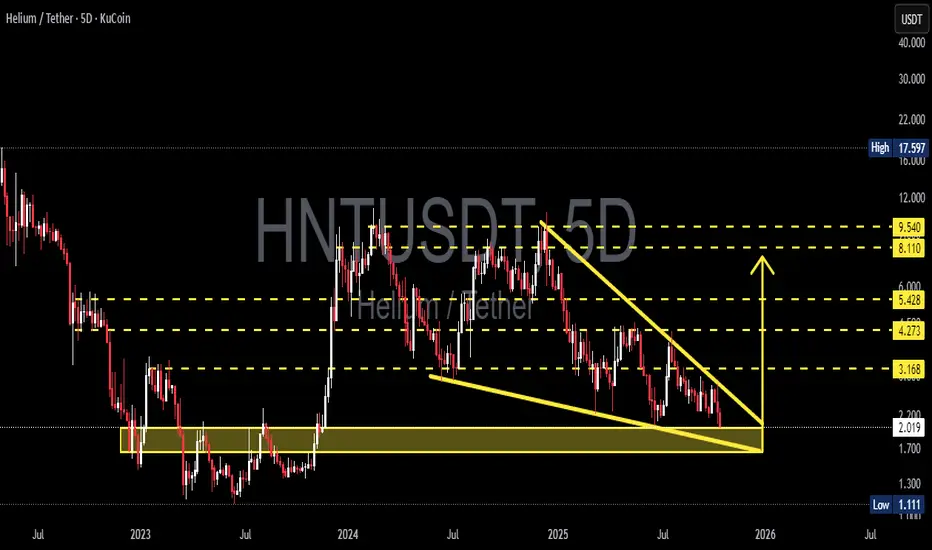
HNT is once again testing its major historical support zone between 1.70–2.02 USDT, a critical demand area that has acted as a price fortress since 2023. The chart is currently forming a Falling Wedge pattern, a classic structure that signals trend exhaustion and potential reversal.
As the wedge tightens near a key support base, volatility compression suggests that a massive move is approaching — either a strong bullish breakout or a capitulation breakdown.
---
🔹 Pattern Explanation
The chart reveals a Falling Wedge pattern — a series of lower highs and lower lows that converge, often preceding a bullish reversal when price breaks upward with strong volume.
HNT is now hovering right above its historical demand zone, signaling potential smart money accumulation before a larger trend shift.
Key Resistance Levels to Watch:
3.168
4.273
5.428
8.110
9.540 USDT
Major Support Zone: 1.70 – 2.02 USDT (yellow box)
---
🟢 Bullish Scenario — Reversal Loading
If HNT can break and close above the upper trendline of the wedge on the 5D timeframe with strong volume confirmation, it would mark the end of the extended downtrend.
Such a breakout could trigger a multi-month recovery rally, with potential upside targets at:
3.16 → 4.27 → 5.42 → 8.11 → 9.54 USDT
Given its proximity to the accumulation zone, the risk-to-reward ratio is highly favorable for swing or position traders anticipating a reversal.
---
🔴 Bearish Scenario — Breakdown to Historical Lows
However, if the 1.70–2.02 USDT support zone fails, bearish momentum could accelerate.
A confirmed 5D close below this level would expose the next potential target near:
1.11 USDT (historical low)
Failure to defend this demand zone could trigger another leg of capitulation, likely marking the final phase of the bearish cycle before true bottom formation.
---
⚖️ Conclusion
HNT is currently standing at a critical inflection point — a zone that will likely determine the next major trend.
The Falling Wedge structure favors a bullish breakout if volume confirms,
but a breakdown below 1.70 would shift the structure into a final bearish continuation phase.
This is a compression-before-explosion setup — and whichever direction breaks first could define the next several months of HNT’s market structure.
#HNT #Helium #HNTUSDT #CryptoAnalysis #TechnicalAnalysis #FallingWedge #SupportZone #Breakout #AltcoinSetup #ChartPattern #BullishSetup #CryptoTrader
✅ Get Free Signals! Join Our Telegram Channel Here: t.me/TheCryptoNuclear
✅ Twitter: twitter.com/crypto_nuclear
✅ Join Bybit : partner.bybit.com/b/nuclearvip
✅ Benefits : Lifetime Trading Fee Discount -50%
✅ Twitter: twitter.com/crypto_nuclear
✅ Join Bybit : partner.bybit.com/b/nuclearvip
✅ Benefits : Lifetime Trading Fee Discount -50%
免責事項
これらの情報および投稿は、TradingViewが提供または保証する金融、投資、取引、またはその他の種類のアドバイスや推奨を意図したものではなく、またそのようなものでもありません。詳しくは利用規約をご覧ください。