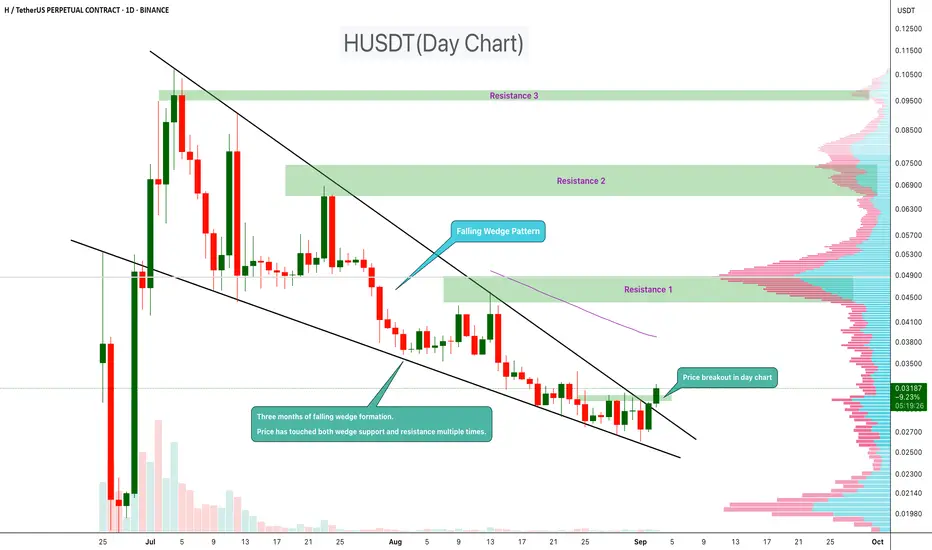
HUSDT has been forming a falling wedge pattern over the past three months. During this period, the price has tested both the wedge support and resistance multiple times, confirming the structure.
Now, a breakout has appeared on the daily chart, suggesting that bullish momentum may be building. Falling wedges are typically seen as reversal patterns, often leading to upside continuation once the breakout is confirmed.
Resistance 1:$0.045
Resistance 2:$0.066
Resistance 2:$0.095
cheers
Hexa
Now, a breakout has appeared on the daily chart, suggesting that bullish momentum may be building. Falling wedges are typically seen as reversal patterns, often leading to upside continuation once the breakout is confirmed.
Resistance 1:$0.045
Resistance 2:$0.066
Resistance 2:$0.095
cheers
Hexa
トレード稼働中
50%+ profit
🚀Telegram : t.me/hexatrades
🌐Website: hexatrades.io/
🗣️Twitter(X): twitter.com/HexaTrades
🌐Website: hexatrades.io/
🗣️Twitter(X): twitter.com/HexaTrades
関連の投稿
免責事項
この情報および投稿は、TradingViewが提供または推奨する金融、投資、トレード、その他のアドバイスや推奨を意図するものではなく、それらを構成するものでもありません。詳細は利用規約をご覧ください。
🚀Telegram : t.me/hexatrades
🌐Website: hexatrades.io/
🗣️Twitter(X): twitter.com/HexaTrades
🌐Website: hexatrades.io/
🗣️Twitter(X): twitter.com/HexaTrades
関連の投稿
免責事項
この情報および投稿は、TradingViewが提供または推奨する金融、投資、トレード、その他のアドバイスや推奨を意図するものではなく、それらを構成するものでもありません。詳細は利用規約をご覧ください。