📈 4-Hour Support & Resistance Levels
Based on recent intraday analysis, the key support and resistance levels for IDFCFIRSTB on a 4-hour chart are:
Support Levels:
₹59.89 (S1)
₹59.15 (S2)
₹58.17 (S3)
Resistance Levels:
₹61.61
₹62.59
₹63.33
These levels are derived from the recent price action and can serve as potential entry or exit points for intraday traders.
🔍 Technical Indicators Overview
Relative Strength Index (RSI): Currently at 39.67, indicating a potential oversold condition and possible reversal if the price holds above key support levels.
Moving Averages:
20-day EMA: ₹56.78
50-day EMA: ₹58.88
100-day EMA: ₹61.87
200-day EMA: ₹66.42
The current price is below these moving averages, suggesting a bearish short-term trend.
Average True Range (ATR): 1.92, indicating moderate volatility.
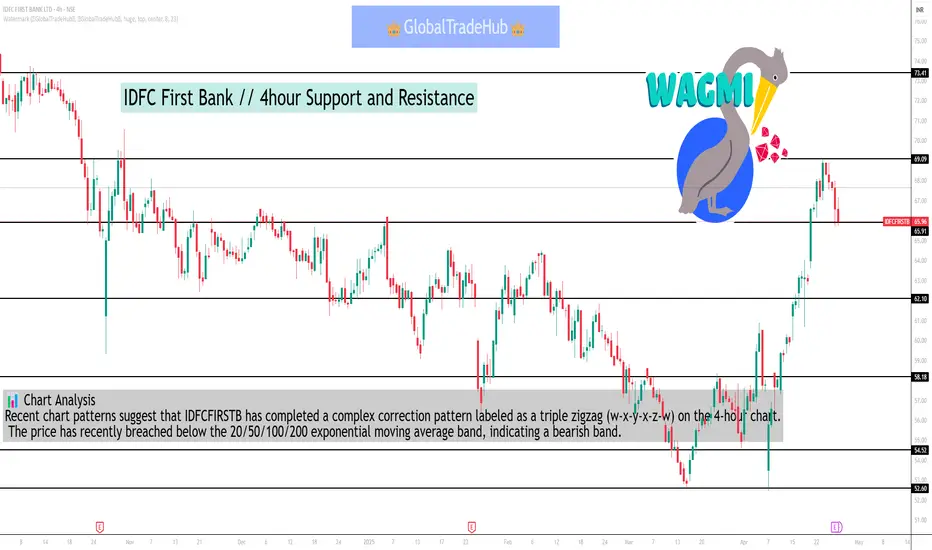
📊 Chart Analysis
Recent chart patterns suggest that IDFCFIRSTB has completed a complex correction pattern labeled as a triple zigzag (w-x-y-x-z-w) on the 4-hour chart. The price has recently breached below the 20/50/100/200 exponential moving average band, indicating a bearish trend.
✅ Trading Strategy
Bullish Scenario: A break above ₹61.61 (R1) with sustained momentum could lead to a rally towards ₹62.59 (R2) and ₹63.33 (R3).
Bearish Scenario: A drop below ₹59.89 (S1) may accelerate the decline towards ₹58.17 (S3).
It's advisable to monitor volume and candlestick patterns for confirmation of breakout or breakdown.
Based on recent intraday analysis, the key support and resistance levels for IDFCFIRSTB on a 4-hour chart are:
Support Levels:
₹59.89 (S1)
₹59.15 (S2)
₹58.17 (S3)
Resistance Levels:
₹61.61
₹62.59
₹63.33
These levels are derived from the recent price action and can serve as potential entry or exit points for intraday traders.
🔍 Technical Indicators Overview
Relative Strength Index (RSI): Currently at 39.67, indicating a potential oversold condition and possible reversal if the price holds above key support levels.
Moving Averages:
20-day EMA: ₹56.78
50-day EMA: ₹58.88
100-day EMA: ₹61.87
200-day EMA: ₹66.42
The current price is below these moving averages, suggesting a bearish short-term trend.
Average True Range (ATR): 1.92, indicating moderate volatility.
📊 Chart Analysis
Recent chart patterns suggest that IDFCFIRSTB has completed a complex correction pattern labeled as a triple zigzag (w-x-y-x-z-w) on the 4-hour chart. The price has recently breached below the 20/50/100/200 exponential moving average band, indicating a bearish trend.
✅ Trading Strategy
Bullish Scenario: A break above ₹61.61 (R1) with sustained momentum could lead to a rally towards ₹62.59 (R2) and ₹63.33 (R3).
Bearish Scenario: A drop below ₹59.89 (S1) may accelerate the decline towards ₹58.17 (S3).
It's advisable to monitor volume and candlestick patterns for confirmation of breakout or breakdown.
関連の投稿
免責事項
これらの情報および投稿は、TradingViewが提供または保証する金融、投資、取引、またはその他の種類のアドバイスや推奨を意図したものではなく、またそのようなものでもありません。詳しくは利用規約をご覧ください。
関連の投稿
免責事項
これらの情報および投稿は、TradingViewが提供または保証する金融、投資、取引、またはその他の種類のアドバイスや推奨を意図したものではなく、またそのようなものでもありません。詳しくは利用規約をご覧ください。