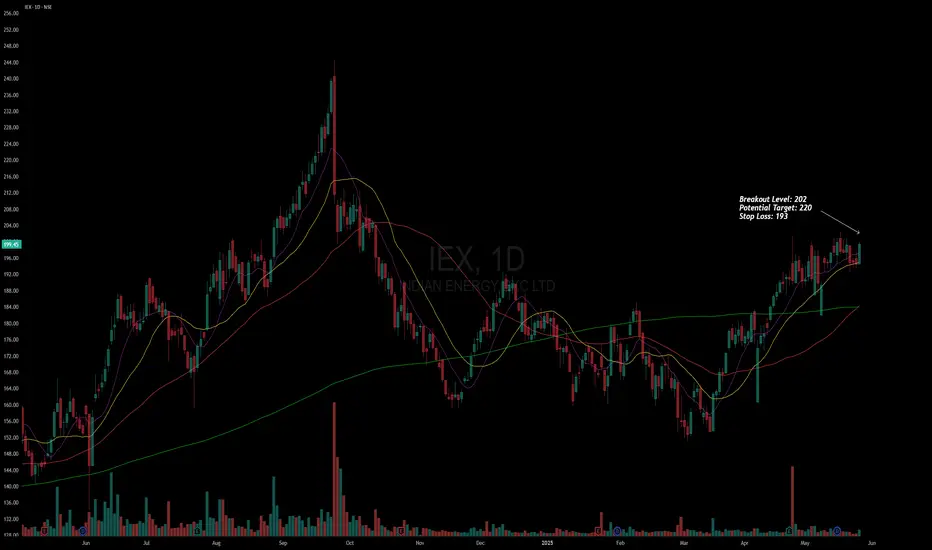
Asset: Indian Energy Exchange Ltd (IEX)
Breakout Level: 202
Potential Target: 220
Stop Loss: 193
Timeframe: Short to Medium term
Risk to Reward ratio : 1:2.5
Rationale:
Fundamentals -
Fundamentally decent stock with the following attributes:
* ROCE - 53.6%
* ROE - 40.5%
* Debt to Equity - 0.01
* Stock PE 42.9 / Industry PE - 57 || Stock PBV 16.2 / Industry PBV 17.4 - Company is underpriced
* EPS / Revenue - Increasing over last 6 months
Technicals -
* Overall structure - Forming a large rounding pattern and surfing the 20 DMA
* Multiple timeframe analysis - Stock poised for up move as the daily / weekly / monthly charts
* On daily charts, the price surged ~2.5% yesterday and volumes increased compared to last 2 days
* Increasing momentum / RS
* ADR 3%
Market analysis
* Forecasted for ~43% further increase
* FIIs/DIIs/Mutual Funds increasing holding
* Retail reducing
* Good results
Cons
* ADR is low which can hint towards a slow moving trade
* No promoter holding
This analysis is for educational purposes only and should not be considered as financial advice. Trading and investing in financial markets involve significant risk, and past performance is not indicative of future results. You should conduct your own research and consult with a qualified financial advisor before making any trading or investment decisions. The author is not responsible for any financial losses or damages that may result from the use of this information.
ノート
Tight action continues. The price is not falling and surfing the moving averages. At the same time the volumes are increasing indicating buying activity. トレード終了: ストップロスに到達
免責事項
これらの情報および投稿は、TradingViewが提供または保証する金融、投資、取引、またはその他の種類のアドバイスや推奨を意図したものではなく、またそのようなものでもありません。詳しくは利用規約をご覧ください。
免責事項
これらの情報および投稿は、TradingViewが提供または保証する金融、投資、取引、またはその他の種類のアドバイスや推奨を意図したものではなく、またそのようなものでもありません。詳しくは利用規約をご覧ください。