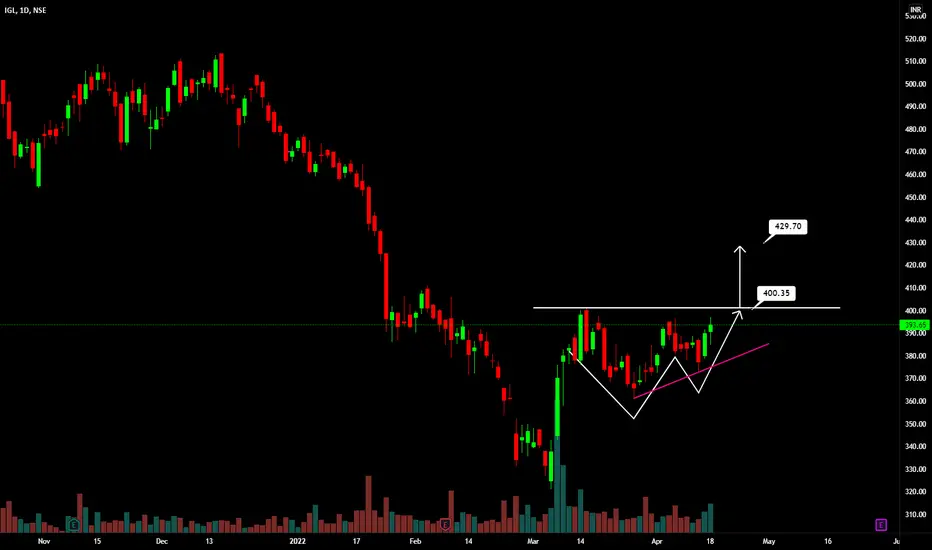
Above chart is a daily chart of IGL.
Double bottom pattern with higher low is visible.
Breaking above 400 will active the trade.
Potential target 430.
Double bottom pattern with higher low is visible.
Breaking above 400 will active the trade.
Potential target 430.
免責事項
これらの情報および投稿は、TradingViewが提供または保証する金融、投資、取引、またはその他の種類のアドバイスや推奨を意図したものではなく、またそのようなものでもありません。詳しくは利用規約をご覧ください。
免責事項
これらの情報および投稿は、TradingViewが提供または保証する金融、投資、取引、またはその他の種類のアドバイスや推奨を意図したものではなく、またそのようなものでもありません。詳しくは利用規約をご覧ください。