Key Technical Indicators:
Oscillators: Neutral
Moving Averages: Strong Buy
Overall Technical Rating: Neutral
Support and Resistance Levels:
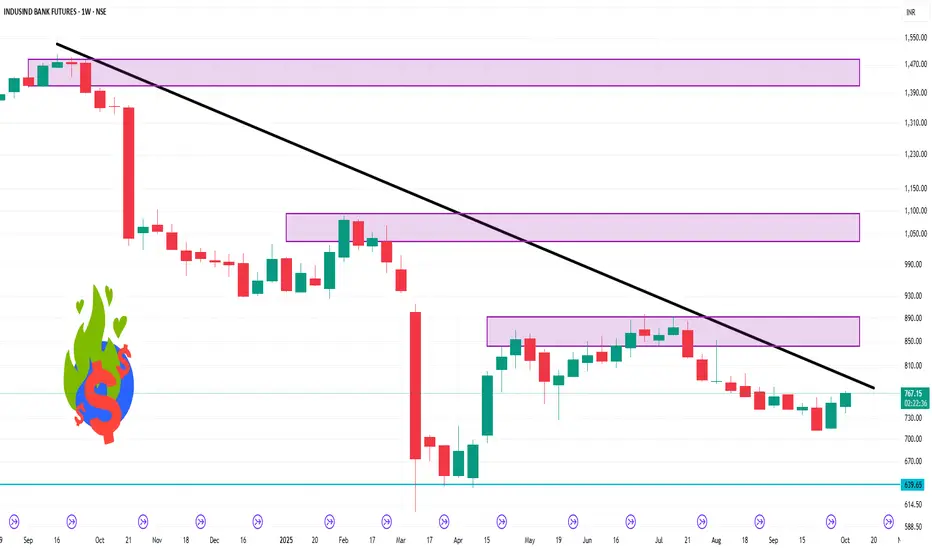
Weekly Pivot Points:
Support: 739.63
Resistance: 766.72
Additional Insights:
Relative Strength Index (RSI): The 14-day RSI is at 70.368, suggesting the stock is approaching overbought conditions, which may indicate a potential pullback
Moving Averages: The 5-day moving average is 755.54, and the 50-day moving average is 744.63, both indicating a bullish trend
Conclusion:
While the overall technical rating is neutral, the price action above the weekly pivot point and the bullish moving averages suggest a potential for upward movement. However, the elevated RSI indicates caution, as the stock may be due for a correction. Traders should monitor these levels closely and consider the broader market conditions before making trading decisions.
Oscillators: Neutral
Moving Averages: Strong Buy
Overall Technical Rating: Neutral
Support and Resistance Levels:
Weekly Pivot Points:
Support: 739.63
Resistance: 766.72
Additional Insights:
Relative Strength Index (RSI): The 14-day RSI is at 70.368, suggesting the stock is approaching overbought conditions, which may indicate a potential pullback
Moving Averages: The 5-day moving average is 755.54, and the 50-day moving average is 744.63, both indicating a bullish trend
Conclusion:
While the overall technical rating is neutral, the price action above the weekly pivot point and the bullish moving averages suggest a potential for upward movement. However, the elevated RSI indicates caution, as the stock may be due for a correction. Traders should monitor these levels closely and consider the broader market conditions before making trading decisions.
関連の投稿
免責事項
これらの情報および投稿は、TradingViewが提供または保証する金融、投資、取引、またはその他の種類のアドバイスや推奨を意図したものではなく、またそのようなものでもありません。詳しくは利用規約をご覧ください。
関連の投稿
免責事項
これらの情報および投稿は、TradingViewが提供または保証する金融、投資、取引、またはその他の種類のアドバイスや推奨を意図したものではなく、またそのようなものでもありません。詳しくは利用規約をご覧ください。