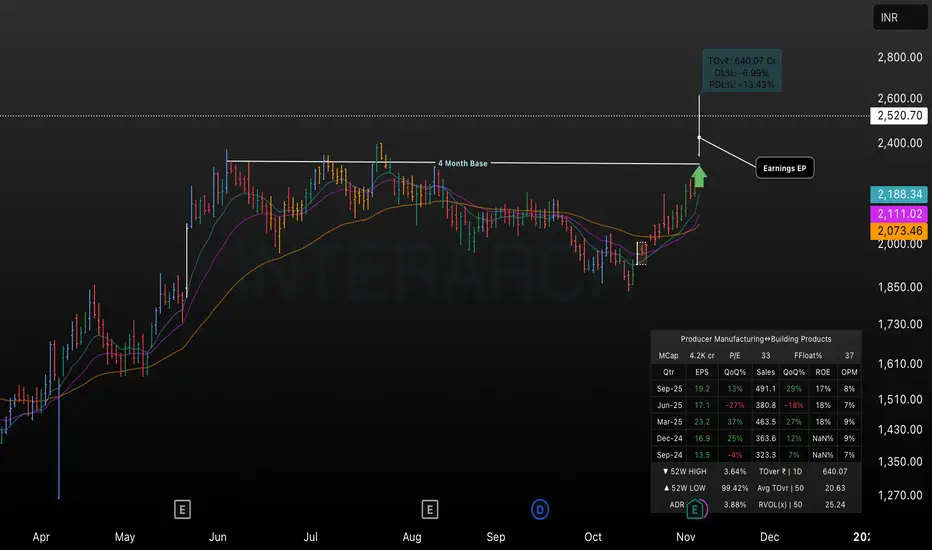
This TradingView chart highlights Interarch’s significant breakout above a 4-month consolidation base, with the price rallying to ₹2,520.70 (+14.87%). Key moving averages are displayed, and the breakout is supported by positive earnings momentum. The annotation indicates an earnings event driving the move. The chart includes box statistics for financials such as market cap, P/E ratio, and quarterly performance, helping visualize recent company fundamentals and price action context.
免責事項
この情報および投稿は、TradingViewが提供または推奨する金融、投資、トレード、その他のアドバイスや推奨を意図するものではなく、それらを構成するものでもありません。詳細は利用規約をご覧ください。
免責事項
この情報および投稿は、TradingViewが提供または推奨する金融、投資、トレード、その他のアドバイスや推奨を意図するものではなく、それらを構成するものでもありません。詳細は利用規約をご覧ください。