📉 INTU – Market Structure Breakdown
I recognize this setup:
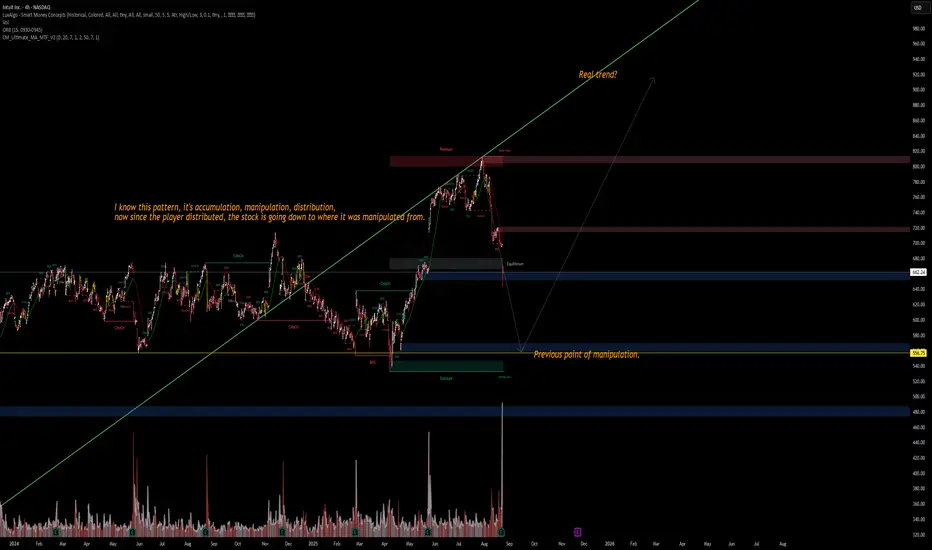
Accumulation ➝ Manipulation ➝ Distribution.
After distribution at the premium zone, price is now breaking down toward the previous point of manipulation.
🔹 Current price: ~662
🔹 Potential downside target: 556–560 zone (previous manipulation base)
🔹 If broken further → risk of deeper move into 480–500 discount range
Key Observations:
Multiple Change of Character (ChoCH) and Break of Structure (BOS) signals confirming distribution.
Volume spikes align with manipulation phases.
Real trend may resume only after price returns to equilibrium zones.
⚠️ Watch for liquidity grabs around 600–610 before continuation lower.
👉 My bias: Short-term bearish, targeting 560, with a potential trend resumption later.
#INTU #Trading #SmartMoney #Stocks
I recognize this setup:
Accumulation ➝ Manipulation ➝ Distribution.
After distribution at the premium zone, price is now breaking down toward the previous point of manipulation.
🔹 Current price: ~662
🔹 Potential downside target: 556–560 zone (previous manipulation base)
🔹 If broken further → risk of deeper move into 480–500 discount range
Key Observations:
Multiple Change of Character (ChoCH) and Break of Structure (BOS) signals confirming distribution.
Volume spikes align with manipulation phases.
Real trend may resume only after price returns to equilibrium zones.
⚠️ Watch for liquidity grabs around 600–610 before continuation lower.
👉 My bias: Short-term bearish, targeting 560, with a potential trend resumption later.
#INTU #Trading #SmartMoney #Stocks
免責事項
これらの情報および投稿は、TradingViewが提供または保証する金融、投資、取引、またはその他の種類のアドバイスや推奨を意図したものではなく、またそのようなものでもありません。詳しくは利用規約をご覧ください。
免責事項
これらの情報および投稿は、TradingViewが提供または保証する金融、投資、取引、またはその他の種類のアドバイスや推奨を意図したものではなく、またそのようなものでもありません。詳しくは利用規約をご覧ください。