- Unveil the mesmerizing journey of Indian Oil Corp Ltd (IOC) on this captivating chart!
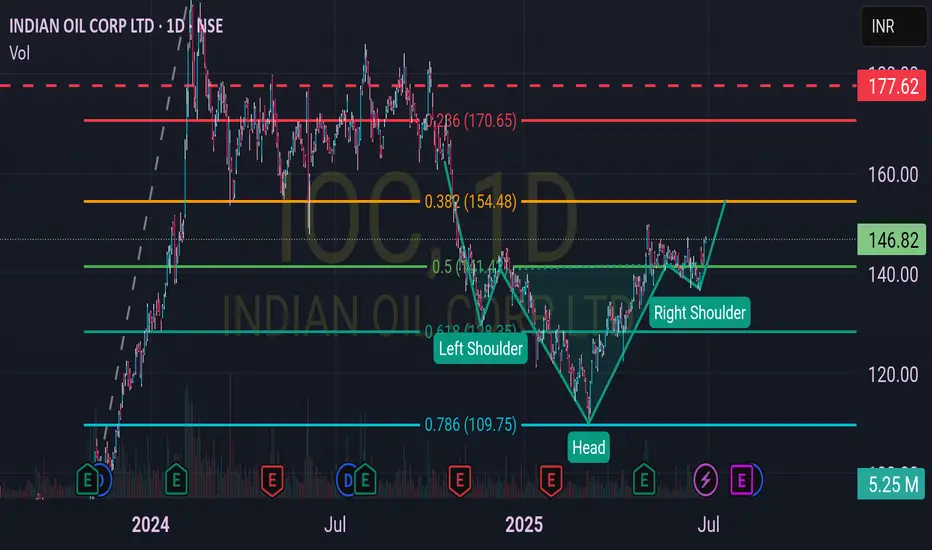
- Behold the Fibonacci levels, meticulously drawn two months ago, revealing a fascinating truth.
- Witness the price action align flawlessly with these golden ratios, a trader's dream come true.
- Marvel at the emerging head and shoulder pattern, hinting at a potential trend reversal.
- Anticipate an exhilarating uptrend as the pattern nears completion, sparking excitement.
- Strategize with a trailing stop from entry, safeguarding your gains with precision.
- Embrace proper risk management to navigate this thrilling market adventure.
- The 0.618 level at ₹154.48 and 0.786 at ₹109.75 have held strong, guiding the price.
- The current price of ₹146.73 teases a breakout, aligning with the right shoulder.
- Prepare for an upward surge, blending Fibonacci magic with pattern perfection!
免責事項
この情報および投稿は、TradingViewが提供または推奨する金融、投資、トレード、その他のアドバイスや推奨を意図するものではなく、それらを構成するものでもありません。詳細は利用規約をご覧ください。
免責事項
この情報および投稿は、TradingViewが提供または推奨する金融、投資、トレード、その他のアドバイスや推奨を意図するものではなく、それらを構成するものでもありません。詳細は利用規約をご覧ください。